
This document reports on the LSCft Bank workforce experiences in relation to the 9 main Bank Workforce Race Equality Standards (BWRES) indicators and their sub indicators. As such, the main aim of this document is to explore the LSCft’s BWRES data and narrative and effectively identify key areas related to the trust’s BME Bank workforce experiences that need improvement.
Report provided for:
- Information
- Assurance
- Discussion
Report to: Trust Board
Date of meeting: 03.10.24
Presented by: Rob Cragg, Chief People Officer
Prepared by: Candace Bedu-Mensah, Head of Diversity and Inclusion
| Link to Quadruple Aim | Joy and pride in work | ||
|---|---|---|---|
| Alligned to Board Assurance Framework Risk | PR8 - Failure to grow, lead and develop our workforce caused by limited development opportunities resulting in a poor organisational culture. | ||
| Executive Summary | This paper provides data relating to representation and experiences of Lancashire and South Cumbria foundation trust (LSCft) bank workers in relation to ethnicity and race. | ||
| Recommendation/ Required Action | The Board is asked to read this report for approval and take into account any escalations. | ||
Contents
- Introduction
- Scope
- Table of Indicators
- Indicator 1
- Indicator 2 and 3
- Indicator 4
- Indicator 5
- Indicator 6a
- Indicator 6b
- Indicator 6c
- Indicator 6d
- Indicator 7
- Indicator 8a
- Indicator 8b
- Indicator 8c and 8d
- Indicator 9
- Conclusion
Introduction
The NHS WRES indicators have been mainly designed to establish racial equality in the workplace and to improve the experience of the BME Workforce. However, through the former years, this reporting was only to depict the experiences of the BME substantive staff and negated the experiences of the Bank BME workforce. BME bank workers play a vital role in the overall running of many of the Trust’s services.
The NHS established a new reporting system to depict the experience of the BME Bank workforce. The bank WRES indicators are different to the original WRES indicators related to the BME substantive staff experiences. It is important to know that there is no national or regional comparative data for the BWRES. Only the metrics from the staff survey which can be compared via the staff survey national and regional data.
The Bank WRES includes nine main indicators. Five of these main indicators have up to 4 sub-indicators each.
Indicators 1 to 3 consider the bank workforce make-up and differences in disciplinary systems and outcomes. The data for these three indicators are extracted from the Electronic Staff Record (ESR) and internal organisational systems.
While, the data related to indicators 4 to 9 are derived from a National NHS Bank Staff Survey to measure the experiences of bank workers in relation to how they are treated, valued and recognised by colleagues; employing organisations; and patients. These indicators also address career aspirations and time worked on the bank. According to the Bank WRES guidance; for year one these indicators will be used for the basis of reporting for organisations that choose to include NHS bank workers in the survey (this was not nationally mandated in 2022).
The Bank WRES indicators have been chosen following consultation and reiteration. They are intended to be as straightforward as possible and are almost entirely based on existing data sources.
This year’s submission covers NHS trusts that currently submit annual WRES data. However, the Bank WRES submission is not a mandatory request for this year, yet, it was recommended and highly encouraged to submit the report this year for learning and feedback purposes. From the next year all NHS Trusts will be required to produce and publish a Bank WRES report on an annual basis to ensure that NHS organisations review their Bank workforce data against the national nine indicators/sub-indicators and produce an action plan that closes any gaps in the workplace experience between Bank BME Staff and White Staff.
3.0 Scope
The parameters for WRES metrics in this report are commissioned and are overseen by NHS England.
LSCft benchmarking data included in this report has been obtained from the following sources:
- Electronic Staff Records (ESR)
- Human Resource team’s records
- NHS Staff Survey
Definitions
BME: Refers to Black and Minority Ethnic groups.
Key Findings
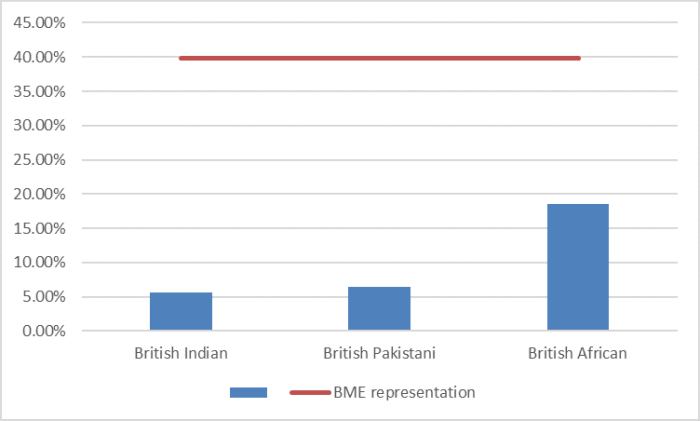
BME: representation on the Bank has increased from 34.3% to 39.9%.
- BME bank workers likelihood of entering a formal disciplinary process has reduced to 1.73 times more likely from 3.63 times in 2023
- 44.2% (62.8% 2023) BME bank workers experienced harassment, bullying or abuse from patients/service users, their relatives, or other members of the public in the last 12 months.
- 40% (36.4% 2023) BME bank workers experienced harassment, bullying or abuse from other colleagues in the last 12 months.
- 75.5% (59.7% 2023) BME bank workers feel they receive the respect that they deserve from colleagues at work.
Table of Indicators
| Metric | 2023 | 2024 | ||
|---|---|---|---|---|
| 1 Percentage of active workers by ethnic group and gender across key grades and staff groups | Men | BME | 19.1% | 22.3% |
| Men | White | 13.1% | 12.2% | |
| Women | BME | 15.2% | 17.5% | |
| Women | White | 48.5% | 42.2% | |
| Other | BME | 34.3% | 39.9% | |
| Other | White | 61.6% | 54.3% | |
| 2. Relative likelihood of BME bank workers entering a formal disciplinary process by ethnic group in the last 12 months | 3.63 | 1.73 | ||
| 3 Relative likelihood of bank workers being formall dismissed by ethnic group in the last months (for conduct and capability) | 2 | 2 | ||
| 4a Percentage of bank workers experiencing harassment, bullying or abuse from patients/ service users, their relatives, or other members of the public in the last 12 months |
BME 62.8% White 41.5% |
BME 44.2% White 32.8% |
||
| 4b Percentage of bank workers experiencing harrassment, bullying or abuse from other colleagues in the last 12 months |
BME 36.4% White 11.3% |
BME 40% White 14.8% |
||
| 4c Percentage of bank workers experiencing harrassment, bullying or abuse from managers in the last 12 months |
BME 15.8% White 11.3% |
BME 10.2% White 9% |
||
| 5a Percentage of bank workers that have personally experienced physical violence from patients/ service users, their relatives, or other members of the public in the last 12 months |
BME 61.5% White 48% |
BME 45.3% White 37.2% |
||
| 5b Percentage of workers who experienced physical violence at work who then proceed to report it |
BME 91.1% White 89.6% |
BME 96.0% White 94.7% |
||
| 6a Percentage of bank workers who would, in the next 12 months consider moving to work in a form of permanent employment in the NHS | BME 25.7% White 24.6% | BME 28.3% White 26.2% | ||
| 6b Percentage of bank workers that feel there are opportunities to develop their career in the organisation | BME 55.3% White 47.1% | BME 76.9% White 43.4% | ||
| 6c Percentage of workers whose main paid source of work is on the bank | BME 75.6% White 70.5% | BME 64.2% White 77.0% | ||
| 6d How long have bank only workers solely worked on the bank | ||||
| Less than 1 year | BME 19.2% White 20.1% | BME 18.9% White 16.4% | ||
| 1-2 years | BME 23.1% White 27.7% | BME 22.6% White 34.4% | ||
| 3-5 years | BME 34.6% White 27.7% | BME 20.8% White 21.3% | ||
| 6-10 years | BME 20.5% White 12.1% | BME 24.5% White 16.4% | ||
| 11 - 15 years | BME 1.3% White 3.6% | BME 7.5% White 4.1% | ||
| More than 15 years | BME 1.3% White 11.6% | BME 3.8% White 6.6% | ||
| 7a Percentage of bank workers that have in the last 12 months personally experienced discrimination at work from managers / team leaders or other colleagues | BME 35.1% White 9.4% | BME 34.0% White 6.6% | ||
| 7b Percentage of bank workers that have in the last 12 months personally experienced discrimination at work from patients, relatives or members of the public | BME 62.8% White 11.7% | BME 44.2% White 8.2% | ||
| 8a Percentage of bank workers who feel that the organisation values their work contribution | BME 41.6% White 44.8% | BME 52.8% White 56.6% | ||
| 8b Percentage of bank workers that feel safe to speak up about anything that concerns them in their organisation | BME 58.1% White 60.5% | BME 58.8% White 62.8% | ||
| 8c Percentage of bank workers that feel they receive the respect they deserve from colleagues at work | BME 64.9% White 65.0% | BME 62.9% White 71.9% | ||
| 8d Percentage of bank workers that feel they recieve the respect they deserve from colleagues at work | BME 59.7% White 73.7% | BME 75.5% White 81.1% | ||
| 9 Percentage of bank workers who were originally recruited to the NHS from outside of the UK and now work in a bank only position | BME 9.0% White 2.3% | BME 5.7% White 1.6% | ||
Indicator one
LSCft has a bank only workforce of 1307 colleagues of which 39.86% are from a BME background. This is an increase in representation compared to 2023 at 34.3%. The bank only representation at LSCft surpasses that of our substantive representation and the known local population representation. When this data is looked at with a gender lens there is a higher representation of BME males (22.34%) compared to BME females (17.52%). These demographics change when we look at the white population on the Bank, 12.17% Male and 45.16% female. It is important to note that 5.81% of bank only workers are classed as not stated and did not declare their ethnicity. However, this is a substantial reduction compared to the 2023 figure of 12.2%.
Following the trends identified within the Workforce Race Equality Standards (WRES) report the main ethnicities represented on the bank are Asian British Indian, Asian British Pakistani and Black British African.
Figure 1: Bank representation by ethnicity
The breakdown of the bank representation by grade and ethnicity shows that within the bank workforce there is a lack of representation at grade 5, 6 and 7 (Cluster 2) and grades 8a and 8b (Cluster 3). This inequality has been described as the glass ceiling and appears to be more pronounced within our bank workforce in both clinical and non clinical roles.
Figure 2: Bank representation by grade cluster
| Non Clinical | BME | % | White | % | Not stated | % | Total per cluster |
|---|---|---|---|---|---|---|---|
|
Custer 1: Bands 1,2,3,4 |
23 | 17.42% | 81 | 61.36% | 28 | 21.21% | 132 |
|
Cluster 2: Bands 5,6,7 |
0 | 0% | 5 | 100% | 0 | 0% | 5 |
| Cluster 3: Bands 8a, 8b | 1 | 33.33% | 1 | 33.33% | 1 | 33.33% | 3 |
| Cluster 4: Band 8c, 8d, 9 and VSM | 0 | 0% | 3 | 100% | 0 | 0% | 3 |
| Non AFC/Other | 0 | 0% | 0 | 0% | 0 | 0% | 0 |
| Non clinical totals | 24 | 16.78% | 90 | 62.94% | 29 | 20.28% | 143 |
| Clinical | BME | % | White | % | Not stated | & | Total per cluster |
|---|---|---|---|---|---|---|---|
|
Custer 1: Bands 1,2,3,4 |
336 | 46.60% | 366 | 50.76% | 19 | 2.64% | 721 |
|
Cluster 2: Bands 5,6,7 |
30 | 12.30% | 208 | 85.25% | 6 | 2.46% | 244 |
| Cluster 3: Bands 8a, 8b | 0 | 0% | 11 | 91.67% | 1 | 8.33% | 12 |
| Cluster 4: Band 8c, 8d, 9 and VSM | 0 | 0% | 0 | 0% | 0 | 0% | 0 |
| Clinical totals | 366 | 37.46% | 585 | 59.88% | 26 | 2.66% | 977 |
Indicator 2 and 3
2. Relative likelihood of BME bank only workers entering a formal disciplinary process within the last 12 months. Relative likelihood of BME bank only workers being formally dismissed in the last 12 months.
3. Relative likelihood of bank workers being formally dismissed by ethnic group in the last 12 months.
BME bank only workers are 1.73 times more likely to enter a formal disciplinary process. This is a substantial improvement compared to last year (3.63). The data for indicator 3 has remained the same. Following the first BWRES report that was completed last year this indicator has been at the centre of the development completed to improve the experience of our bank only colleagues. This includes the same steps taken to remove in the inequalities within HR process as detailed with our WRES such as multidisciplinary case conferences with diversity and inclusion (D&I) team attendance. However, in relation to bank there is now additional scrutiny towards any restrictions or decisions put in place as we recognise the disproportionate impact such as the loss of income. There is also now an additional question that is put towards any complaint or concern. Would this be reviewed or contemplated differently if this was a substantive or non BME colleague? As stated above there is national or regional comparative data yet for this indicator.
Indicator 4
The Percentage of BME bank workers experiencing harassment, bullying or abuse from:
- (a) Patients/service users, their relatives, or other members of the public in the last 12 months
- (b) Other colleagues in the last 12 months
- (c) Managers in the last 12 months
Figure 3: percentage of staff experiencing harassment, bullying or abuse from patients, relatives or the public (a), other colleagues (b), Managers (c) in the last 12 months.
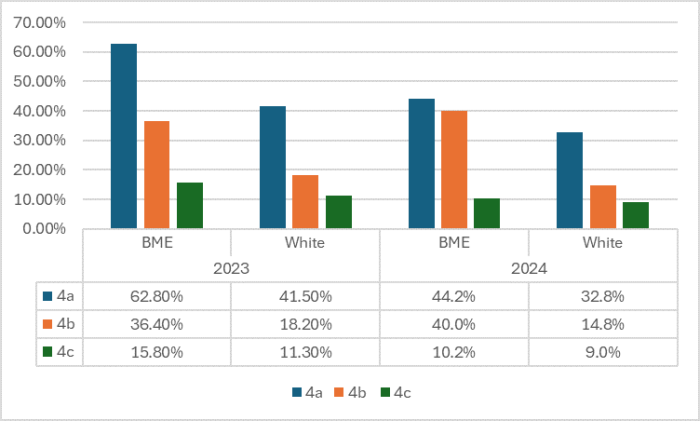
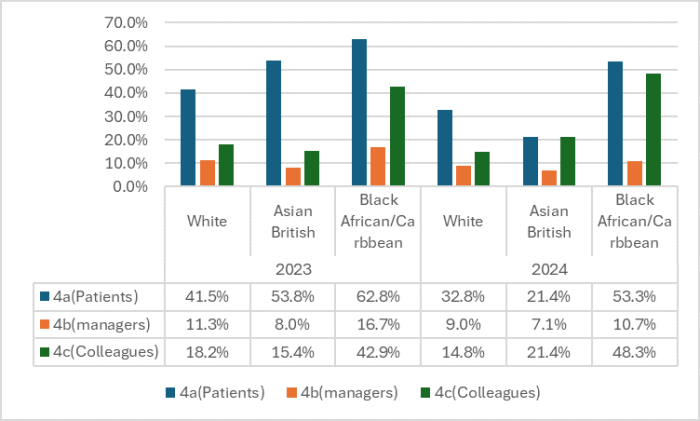
There has been a substantial improvement for indicator 4a and 4c and a slight deterioration for 4b. There has also been an improvement across these metrics when we look at these via ethnicity groups apart from 4c (from managers) for Asian British and African/Caribbean.
Figure 4: Percentage of staff experiencing harassment, bullying or abuse from patients, relatives or the public (a), other colleagues (b), Managers (c) in the last 12 months vs ethnicity
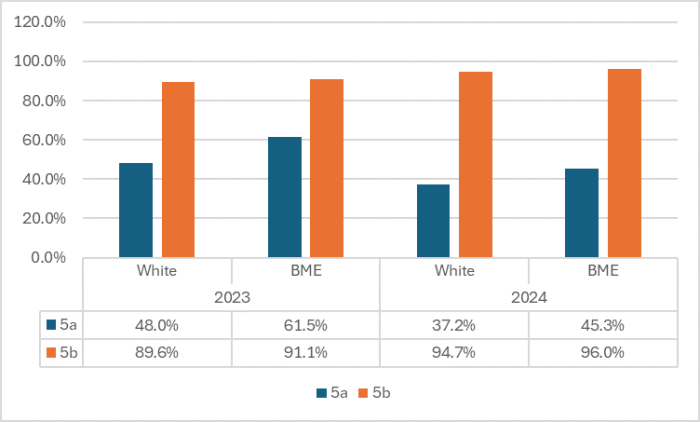
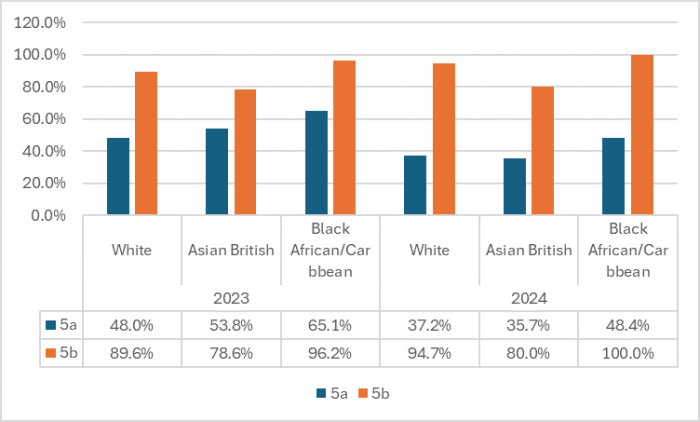
Indicator 5
- (a) The percentage of BME bank workers that have personally experienced physical violence from patients/service users, their relatives or other members of the public in the last 12 months.
- (b) Percentage of BME bank workers who experienced physical violence and then proceeded to report it.
Like indicator 4 there has been a substantial improvement regarding indicator 5. The percentage of both BME and white bank workers that have experienced physical violence has reduced along with a rise in rate of reporting which suggests an increase in a sense of safety.
Figure 5: Percentage of bank workers that have experienced physical violence for service user and percentage that reported physical violence vs ethnicity group
When we look at indicator five in line with ethnicity the improvement pattern remains the same.
Figure 6: Percentage of bank workers that have experienced physical violence for service user and percentage that reported physical violence vs ethnicity group vs ethnicity.
Indicator 6a
The percentage of BME bank only workers who would in the next 12 months consider moving to work in a form of permanent employment in the NHS.
Figure 7: Percentage of BME bank only workers who would in the next 12 months consider moving to work in a form of permanent employment in the NHS vs ethnicity group.
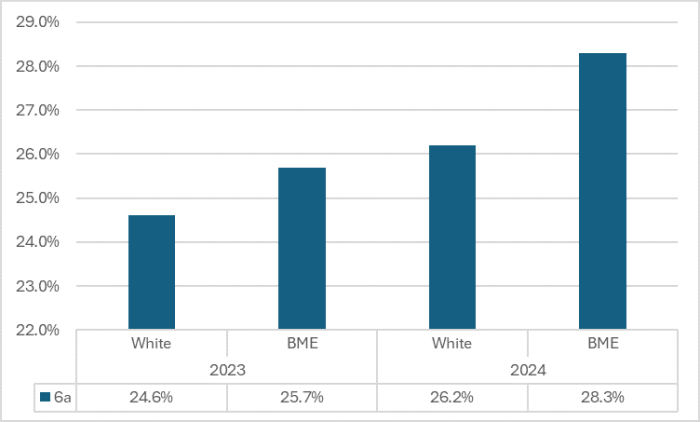
There has been an improvement with this metric overall for bank workers and there is a higher percentage of BME bank only workers that would consider moving to a permanent for of employment in the NHS.
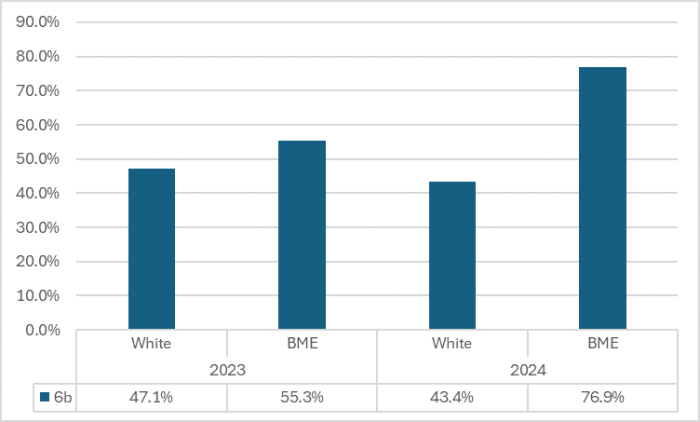
Indicator 6b
Percentage of bank only workers that feel there are opportunities to develop their career in the organisation.
There has been a decrease in the percentage of white bank workers who believe that the organisation offers opportunities to develop their career and a substantial increase in the percentage of BME bank workers.
Figure 8: Percentage of bank only workers that feel there are opportunities to develop their career in the organisation vs ethnicity group
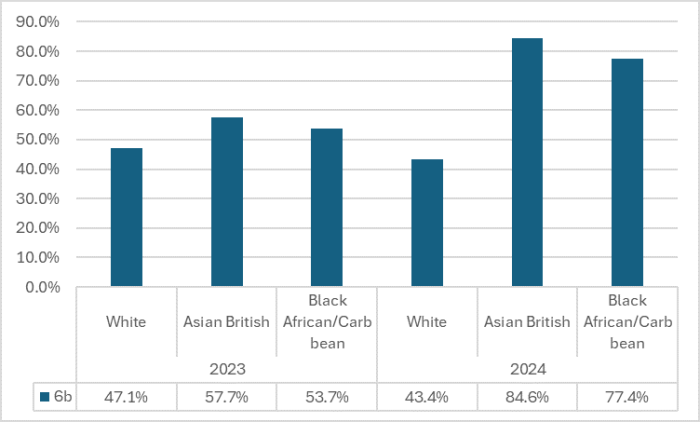
This trend continues when we look at the data in regard to ethnicity, with a slightly less pronounced improvement for bank workers from a African/Caribbean background.
Figure 9: Percentage of bank only workers that feel there are opportunities to develop their career in the organisation vs ethnicity
Indicator 6c
The percentage of BME bank workers whose main paid source of work is on the bank.
There has been a reduction in the percentage of BME bank workers (64.2% 2024 – 75.6% 2023) whose main source of income is the bank compared to a 6.5% increase for white bank workers. This pattern remains the same across the ethnicity groups with the smallest decrease within the African/Caribbean ethnicity group.
Asian British – 69.2% 2023 to 57.1% 2024
African/Caribbean – 79.1% to 71%
Indicator 6
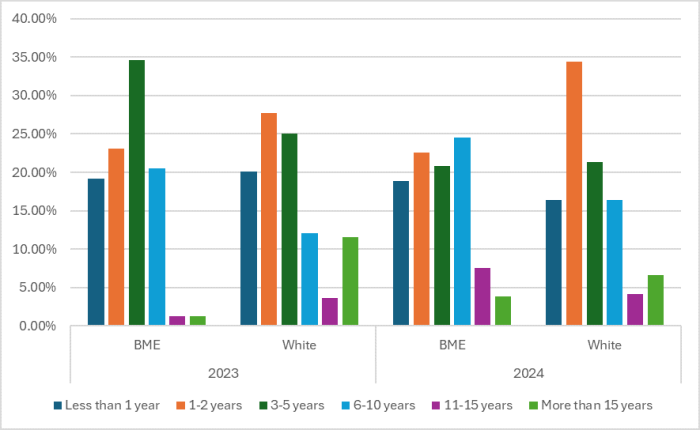
How long have bank only workers solely worked on the bank?
The data shows that for both white and BME bank workers most have been on the between two and five years.
Figure 10: How long have bank only workers solely worked on the bank in years vs ethnicity group
Indicator 7
- (a) The percentage of bank workers that have in the last 12 months personally experienced discrimination at work from manager/team leaders or other colleagues.
- (b) The percentage of bank workers that have in the last 12 month personally experienced discrimination at work from patients/service users, relatives or members of the public.
There has been a slight reduction in the percentage of BME bank workers that personally experienced discrimination form managers or team leaders, however, there has been a larger reduction for white bank workers and a widening of the disparity gap. However there has been a substantial reduction for this indicator in relation to patients or service users. The reduction was more profound for BME bank workers.
Figure 11: Percentage of bank workers that have in the last 12 months personally experienced discrimination at work from manager/team leaders or other colleagues and the percentage of bank workers that have in the last 12 month personally experienced discrimination at work from patients/service users, relatives or members of the public vs ethnicity group
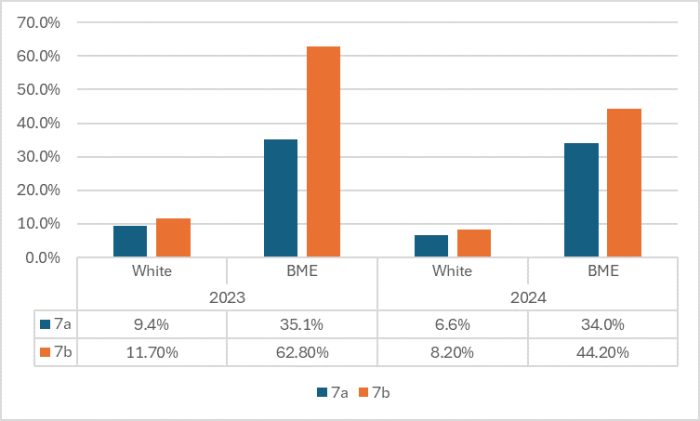
Figure 12: Percentage of bank workers that have in the last 12 months personally experienced discrimination at work from manager/team leaders or other colleagues and the percentage of bank workers that have in the last 12 month personally experienced discrimination at work from patients/service users, relatives or members of the public vs ethnicity.
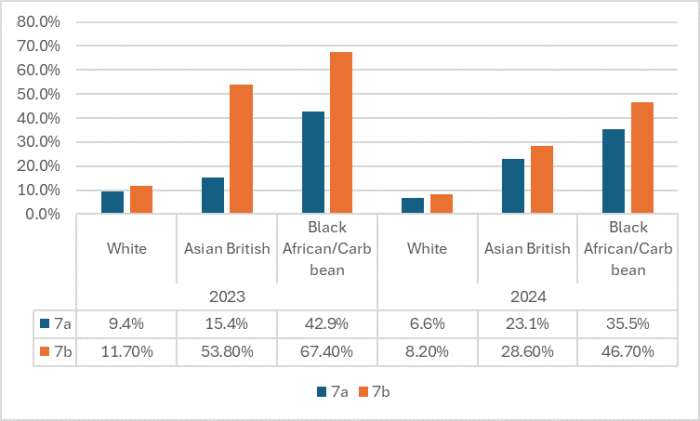
When this indicator is looked at with an ethnicity lens there has been an increase of just over 7% regarding discrimination from managers or team leaders for bank workers from an Asian British background. Despite the reductions for the other ethnicities bank workers from an African/Caribbean background have the highest disparity regarding these indicators.
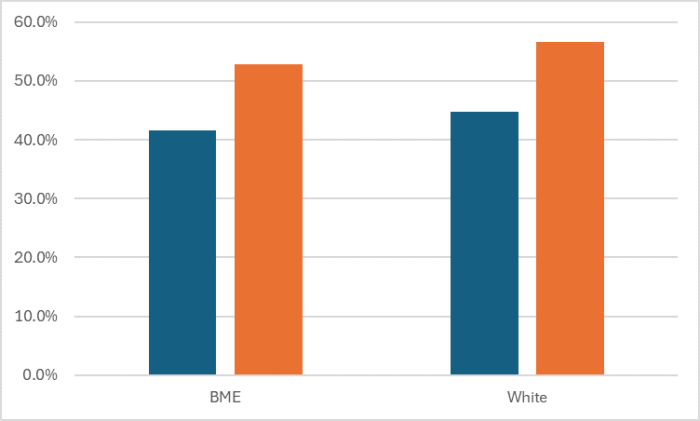
Indicator 8a
The percentage of bank workers who feel that the organisation values their contribution.
There has been an improvement for both white and BME bank workers in relation to this indicator and a narrowing of the gap between experiences.
Figure 13: The percentage of bank workers who feel that the organisation values their contribution vs ethnicity group.
Indicator 8b
The percentage of bank workers that feels safe to speak up about anything that concerns them in their organisation.
There has been a marginal improvement in this indicator for both BME and white bank workers. Looking at this indicator by ethnicity shows that bank workers from a Asian British background feel the most confident to speak up and bank workers from a African/Caribbean background have the least confidence to speak up.
Figure 14: Percentage of bank workers that feels safe to speak up about anything that concerns them in their organisation vs ethnicity group.
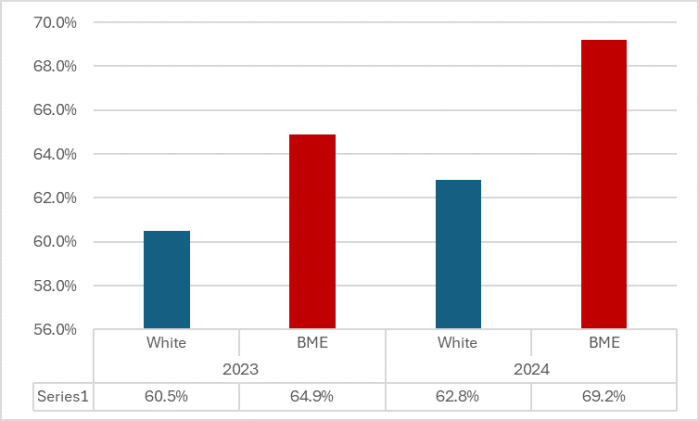
Figure 15: Percentage of bank workers that feels safe to speak up about anything that concerns them in their organisation vs ethnicity.
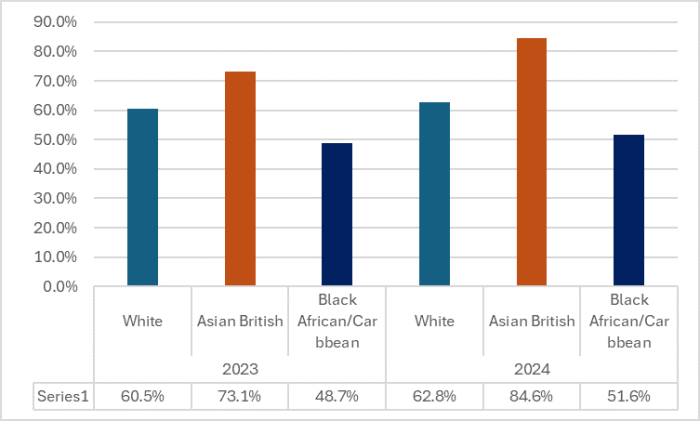
Indicator 8c and 8d
- (c) The percentage of bank workers that think the organisation respects individual differences (e.g. cultures, working styles, backgrounds, ideas, etc.)
- (d) Percentage of bank workers that feel they receive the respect they deserve from colleagues at work.
Both of these indicators for both B<E and white bank workers saw an improvement and a closing of the disparity gap.
| 8c The percentage of bank workers that think the organisation respects individual differences (e.g. cultures, working styles, backgrounds, ideas, etc.) | BME | 64.9% | 69.2% |
|---|---|---|---|
| White | 65% | 71.9% | |
| 8d Percentage of bank workers that feel they receive the respect they deserve from colleagues at work | BME | 59.7% | 75.5% |
| White | 73.7% | 81.1% |
Indicator 9
The percentage of bank workers who were originally recruited to the NHS from outside of the UK and now work in a bank only position.
There has been a decrease for both BME and white bank workers for this indicator.
| 9 percentage of bank workers who were originally recruited to the NHS from outside of the UK and now work in a bank only position | BME | 9% | 5.7% |
|---|---|---|---|
| White | 2.3% | 1.6% |
Risks
The indicators that will form the priorities of 24/25 based on detriment, alignment to national and regional plans are as follows:
High risk:
| No | Description | Alignment |
|---|---|---|
| 2 | Relative likelihood of BME bank workers entering a formal disciplinary process by ethnic group in the last 12 months |
NW BAME Anti-Racist Framework – Bronze
High Impact Action 6
NHS Long-term workforce plan - Retain |
| 3 | Relative likelihood of bank workers being formally dismissed by ethnic group, in the last 12 months (for conduct and capability). |
NW BAME Anti-Racist Framework – Bronze
|
| 4 a/b/c | Percentage of bank workers experiencing harassment, bullying or abuse from Patients/other colleagues and managers. |
NW BAME Anti-Racist Framework – Bronze
|
| 5a | Percentage of bank workers that have personally experienced physical violence from patients/service users, their relatives, or other members of the public in the last 12 months. |
NW BAME Anti-Racist Framework – Bronze
|
Conclusion
This is the second time that LSCft has completed the BWRES report, and it is important to note that this is not a mandated report but as an organisation there is a understanding that without the exploration of data we cannot drive change that will have a positive impact. In year two of this report, we have already so some substantial improvements in the experiences that our bank workforce are having. We have also seen an increase in the number of bank workers completing the survey to generate the report. However, the data does show us the same pattern that our WRES and GPG data does. That colleagues from a black African background experience the most detriment within LSCft. Therefore, this now needs to be the driving force for change.
Recommendations
The Board is asked to read this report for approval and consider any escalations