
This report contains LSCft gender pay gap information and is our position at 31 March 2024. The Trust is open and transparent with this data and is completed in partnership with LSCft’s Staff Women’s Network. This is a government legislated report which is enforced under The Equality Act 2010 Specific Duties and Public Authorities Regulations.
Report provided for:
- Assurance
- Information
Report to: Trust Board
Date of meeting: 03.10.2024
Presented by: Rob Cragg
Prepared by: Candace Bedu-Mensah, Head of Diversity and Inclusion
Contents
- Introduction and background
- Scope and metrics
- Language
- Key findings
- Base hourly rate analysis
- Intersectional pay gap
- Pay quartiles
- Bonus pay splits
- Conclusion
- Recommendations
Introduction and background
In 2017, the Government introduced legislation making it statutory for organisations with 250 or more employees to report annually on their gender pay gap. The Equality Act 2010 Specific Duties and Public Authorities Regulations came into force on 31 March 2017 and underpin the Public Sector Equality Duty.
This report contains Lancashire and South Cumbria NHS Foundation Trust’s (LSCft) gender pay gap information and is our position at 31 March 2024. The Trust is open and transparent with this data, which is completed in partnership with LSCft’s staff Women’s Network. We recognise that not all employees identify with a binary gender but current staff record systems require them to be categorised as such. This report reflects that situation, not the organisation’s view on non-binary gender. In the report, we do use the term Black and Minority Ethnic (BME) to identify differences in the data linked to race, as this is the terminology used in NHSE equality reporting technical guidance for NHS specific standards. However we do recognise that individuals from various backgrounds and ethnicities have different experiences and that it is important to understand these differences when driving and implementing change.
Scope and metrics
The parameters for this report are stipulated by government requirements.
The data included in this report has been obtained from the below source:
• Electronic Staff Records (ESR)
Language
|
Mean gender pay gap |
The difference between the mean hourly rate of pay of male full-pay relevant employees and that of female full-pay relevant employees |
|---|---|
|
Median gender pay gap |
The difference between the median hourly rate of pay of male full-pay relevant employees and that of female full-pay relevant employees |
|
Mean bonus pay gap |
The difference between the mean bonus pay paid to male relevant employees and that paid to female relevant employees |
|
Median bonus pay gap |
The difference between the median bonus pay paid to male relevant employees and that paid to female relevant employees |
|
Bonus proportions |
The proportions of male and female relevant employees who were paid bonus pay during the relevant period |
|
Quartile pay bands |
The proportions of male and female full-pay relevant employees in the lower, lower middle, upper middle and upper quartile pay bands |
AFC – Agenda for Change
BME – Black and minority ethnic
Key Findings
- The mean gender pay gap for employees on the AFC pay scale is 1%. This means that females earn 99p for every £1 that males earn, this is an improvement from 98p in 2023.
- The mean gender pay gap overall is 9.1% (2023 – 12.2%)
- The median gender pay gap overall is 0.2% (2023 – 1.1%) and for AFC employees this reduces to -3.8% (-0.7%)
- BME females earn 84p for every £1 that BME males earn (2023- 78p)
- African females earn 89p for every £1 that African males earn
- Excluding Medics BME males earn on average £1.08 less per hour than white males (2023 – 60p)
- Mean clinical excellence award pay gap is 21.7% (2023 – 17.1%)
- Median clinical excellence award pay gap is 0% (2023 – 0%)
Base hourly rate analysis
The headcount of the Trust workforce is 78% female (79% 2023) and 22% male. The pay gap has slightly decreased this year overall but when we look at the ethnicity pay gap this is not the same across the board.
Figure 1: Trust Average hourly rate, overall and AFC
Overall AfC only
| Gender | Headcount | Average hourly rate | Medium hourly rate | Headcount | Average hourly rate | Medium hourly rate |
|---|---|---|---|---|---|---|
| Male | 1,830 | 20.56 | 17.72 | 1,690 | 18.35 | 17.04 |
| Female | 6,538 | 18.70 | 17.68 | 6,406 | 18.17 | 17.68 |
| Difference | 4,708 | 1.86 | 0.03 | 4,716 | 0.18 | -0.65 |
| Pay gap % | 9.1% | 0.2% | 1.0% | -3.8% |
The LSCft ethnicity pay gap highlights that there is an increased disparity when we look at the Gender Pay Gap data based on ethnicity. The overall BME pay gap shows that BME females earn 84p for every £1 this is a deterioration to the 2023 data at 78p. The AFC BME pay gap shows that BME females earn 96p for every £1 this shows an increased disparity to the overall Trust pay gap at 99p for every £1. The data also shows that excluding Medics BME males earn on average £1.08 less per hour than white males, this is a deterioration to 2023 – 60p.
Figure 2: Trust BME average hourly rate, overall and AFC
| BME | Overall | AFC | ||
|---|---|---|---|---|
| Gender | Headcount | Average hourly rate | Headcount | Average hourly rate |
| Male | 562 | 22.38 | 470 | 17.72 |
| Female | 809 | 18.65 | 752 | 17.17 |
| Difference | 247 | 3.53 | 282 | 0.55 |
| Pay gap % | 15.4% | 3.1% | ||
As a Trust we understand the need to break down the term BME and look at the data based on ethnicity groups. The biggest pay gap for AFC is seen within the Pakistani ethnicity group, closely followed by Indian.
Figure 3: Trust average AFC hourly rate and mean pay gap by ethnicity group
|
Gender White |
Headcount | Average hourly rate |
|---|---|---|
| Male | 1171 | 18.66 |
| Female | 5526 | 18.30 |
| Difference | 4355 | 0.36 |
|
Gender Indian |
Headcount | Average hourly rate |
|---|---|---|
| Male | 116 | 17.72 |
| Female | 223 | 16.72 |
| Difference | 107 | 1 |
|
Gender Pakistani |
Headcount | Average hourly rate |
|---|---|---|
| Male | 82 | 17.30 |
| Female | 160 | 16.04 |
| Difference | 78 | 1.26 |
|
Gender African |
Headcount | Average hourly rate |
|---|---|---|
| Male | 176 | 18.02 |
| Female | 156 | 17.56 |
| Difference | 20 | 0.46 |
Looking the average hourly pay rates overall, Indian and Pakistani have the highest average pay rate. Looking at AFC, only Caribbean and White have the highest average pay rate.
Figure 4: Trust average overall hourly rate by ethnicity group
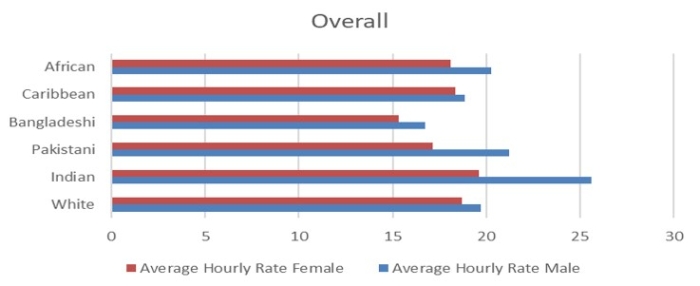
Figure 5: Trust average AFC hourly rate by ethnicity group.

Within non AFC pay grades there is a pay gap in favour of females and we also see this emerging from band 8b to band 9, this then reverts back within medical and dental grades with the biggest pay gap at the Very Senior Manager (VSM) level.
Figure 6: Trust average hourly rate by band.

Non AfC female 31.32, Band 1, Band 2,14.47, Band 3, 15.13, Band 4, 13.76, Band 5, 16.95, Band 6, 20.63, Band 7 23.80, Band 8a 26.88, Band 8b, 31.43, Band 8c, 37.24, Band 8d, 44.68, Band 9, 52.59, Dental 42.85, Medical 43.84, Very Senior Manager (VSM) 56.95.
When looking at the average hourly rate by band and ethnicity this trend changes slightly compared to the overall data. There is a pay gap in favour of BME females at Bands 2, 8b, 8c and no male BME representation at band 9. Similar to the overall Trust data this reverts back within medical and dental roles with the biggest pay gap at VSM level.
Figure 7: Trust BME average hourly rate by band.

Male 2024: BME Band 2, 12.12, BME Band 3, 16.47, BME Band 4, 13.91, BME Band 5, 18.08, BME Band 6, 20.53, BME Band 7, 23.64, BME Band 8a, 26.85, BME Band 8b, 28.56, BME Band 8c, 36.01, BME Band 8d, 42.74, BME Band 9, 0.00, BME Dental, 43.29, BME Medical, 46.15, BME Non AfC, 36.29, BME Very Senior Manager (VSM), 69.04
Intersectional pay gap
The LSCft pay gap when looked at with an intersectional lens highlights the disparities within different groups regarding pay. In 2023 the highest pay gap is identified when we look at the intersection sexual orientation. The data shows that our colleagues that have identified as bisexual have a pay gap of 15% meaning that for every £1 that a heterosexual colleague earns, a bisexual colleague earns 85p. In 2024 our colleagues that have selected a sexual orientation that is not listed (other) have the same pay gap of 15%. When we look at our Gay and Lesbian colleagues, there is a pay gap within their favour. There has been an improvement in the pay gap with a race and disability lens.
Figure 8: Trust pay gap% by intersection (characteristic)
| 2023 | 2024 | |||
|---|---|---|---|---|
| Intersection | Pay gap % | Earn £ for every £1 | Pay gap % | Earn £ for every £1 |
| Race (BME) excluding medical and dental | 6% | 94p | 5% | 95p |
| Disabled | 9% | 91p | 7% | 93p |
| Bisexual | 15% | 85p | 12% | 88p |
| Gay or Lesbian | -6% | £1.06 | -5% | £1.05 |
| Other | 4% | 96p | 15% | 85p |
Pay quartiles
Figure 9: Trust hourly pay quartiles
Lower quartile:
- Male: 21.0%
- Female: 79.0%
Lower middle quartile:
- Male: 22.3%
- Female: 77.7%
Upper middle quartile:
- Male: 19.3%
- Female: 80.7%
Upper quartile:
- Male: 24.8%
- Female: 75.2%
The quartile breakdowns required under GPG reporting show the proportion of females and males at different pay levels. Considering organisational split is 78% female and 22% male this highlights the disparities in representation between staff in different quartiles – with 79% of females in the lower quartile compared to 75.2% in the upper quartile.
Bonus pay splits
The mean gender pay gap between male and female bonus pay is 21.7% and the median gender pay gap is 0%. The bonus payments relate to Clinical Excellence Awards given to consultants.
Figure 10: Trust bonus pay splits and median
| Gender | Average bonus pay | Median |
|---|---|---|
| Male | 7,212.42 | 3,218.75 |
| Female | 5,648.28 | 3,218.75 |
| Difference | 1,564.14 | 0.00 |
| Pay gap % | 21.7% | 0.0% |
Figure 11 - Trust bonus pay eligibility splits
| Gender | Employees paid bonus | Total employees | % |
|---|---|---|---|
| Male | 48 | 1,830 | 2.6% |
| Female | 39 | 6,538 | 0.6% |
Conclusion
This reports highlights that although our workforce is made up of a higher proportion of females there is still a pay gap that shows disparities that seem to effect lower and upper quartile positions. The biggest disparity when we look at the pay gap within ethnicity groups is for females of Pakistani origin closely followed by females from an Indian background. Looking at the pay gap with an intersectional lens highlight that there is a significant disparity when looking at this with a sexual orientation lens.
Included in our action planning for 24/25 there are clear deliverables to continue to develop the intersectional lens of this report. There is also a clear link to identifying the disparities at leadership levels which is a key driver for the pay gap. The women’s network will work alongside the OD team to support how we can monitor and encourage representation which directly impacts the disparities which are highlighted within the data. This includes representation on our core leadership development pathway, within Coaching and Mentoring and across other versions of CPD and development.
There is also continued work alongside all the Staff Networks to build awareness of the gender pay gap and how the data aligns to their agendas.
Recommendations
We ask the Board to review this report and provide feedback on how we can improve this version of the report along with comments on the action plan to improve future reports and influence real change.