
This paper provides data relating to representation and experiences of LSCft colleagues who identify as Disabled. It is mandated by NHS England and used to measure progress, benchmark against national data and create actions to drive change.
Report provided for:
- Assurance
- Information
Report to: Trust Board
Date of meeting: 03.10.2024
Presented by: Rob Cragg
Prepared by: Joanna Harrison, Diversity and Inclusion Manager
| Link to Quadruple Aim |
All quadruple aims |
|---|---|
| Aligned to Board Assurance Framework Risk |
PR9 - Failure to provide employment opportunities proportionate to the diverse communities we serve, caused by poor staff experience impacting on the continuity of care delivery. |
| Executive summary |
This paper provides data relating to representation and experiences of LSCft colleagues who identify as disabled. It is mandated by NHS England and used to measure progress, benchmark against national data and create actions to drive change. |
| Recommendation/required action |
The Board is asked to read this report for approval and take into account any escalations. |
Contents
- Introduction and background
- Table of indicators
- Metric 1 – Percentage of staff who class themselves as having a disability or not
- Metric 2 – Relative likelihood of Disabled candidates being appointed from shortlisting
- Metric 3 – Relative likelihood of Disabled staff entering formal capability process
- Metric 4a – Percentage of staff experiencing harassment, bullying or abuse from patients, relatives or the public in last 12 months
- Metric 4b – Percentage of staff experiencing harassment, bullying or abuse from managers in last 12 months
- Metric 4c – Percentage of staff experiencing harassment, bullying or abuse from colleagues in last 12 months
- Metric 4d – Percentage of staff saying they, or a colleague, reported harassment, bullying or abuse
- Metric 5 - Percentage of staff who believe that the organisation provides equal opportunities for career progression / promotion
- Metric 6 - Percentage of staff who have felt pressure from their manager to come to work despite not feeling well enough to perform duties
- Metric 7 - Percentage of staff satisfied with the extent to which their organisation values their work
- Metric 8 - Percentage of disabled staff who said their employer has made adequate adjustments to enable them to carry out their work
- Metric 9 - Staff engagement score
- Metric 10 - Board and Executive Team who class themselves as having a disability
- Benchmarking against national WDES data
- Risks
- Conclusion
Introduction and background
The NHS Workforce Disability Equality Standard (WDES) is designed to improve workplace experience and career opportunities for Disabled people working, or seeking employment, in the NHS. The WDES follows the NHS Workforce Race Equality Standard as a tool and an enabler of change.
The WDES is included in the NHS standard contract and since 2019 it has been a yearly requirement of all NHS Trusts and Foundation Trusts to submit data and publish an action plan.
NHS Trusts are required to produce and publish a WDES report on an annual basis by 31 October. The purpose of the WDES is to ensure that NHS organisations review their data against the ten metrics and produce an action plan to close any gaps in the workplace experience between Disabled and non-disabled staff.
Throughout this report, a capital ‘D’ has been used when referring to Disabled staff. This is in line with national WDES reporting and is a conscious decision, made to emphasise that barriers continue to exist for people with long-term conditions. The capital ‘D’ also signifies that Disabled people have a shared identity and are part of a community that continues to fight for equality.
Scope
The parameters for WDES metrics and this report are commissioned and are overseen by NHS England.
The data included in this report was obtained on 31 March 2024 from the following sources:
- Electronic Staff Records (ESR)
- Human Resource team records
- Organisational Development records
The 2023 NHS Staff Survey is used for metrics relating to staff experience.
Definitions
Disability: defined by the Equality Act 2010 as, "a physical or mental impairment which has a substantial and long-term adverse effect on a person’s ability to carry out normal day-to-day activities."
The Act defines long-term in this context as, "having lasted, or being likely to last for at least 12 months or the rest of the person’s life."
Substantial is defined as, "more than minor or trivial." People with cancer, HIV and multiple sclerosis are protected effectively from the point of diagnosis.
The Equality Act 2010 applies equally to people who have a long-term condition who may not identify with the term disability. The Trust recognises the Social Model of Disability, which proposes that people are disabled because of societal barriers, rather than a long-term health condition.
The NHS Staff Survey asks staff, "Do you have any physical or mental health conditions or illnesses lasting or expected to last for 12 months or more?" Those who respond yes are recorded as Disabled.
Key findings
- 0.8% increase in Disabled employees reporting on ESR (total 8.6%)
- 0.12 decrease in the likelihood of Disabled candidates being appointed from shortlisting (from 1.16 to 1.18)
- 2.9 increase likelihood of Disabled employees being in a formal capability process (from 1.3 to 4.2)
- Improvements on metrics of Disabled staff experiencing harassment, bullying and abuse from public, managers and colleagues, with gap between disabled and non-disabled narrowing to 7.13% from public and widening to 7.23% from managers and 4.23% from colleagues
- 2.5% decrease in numbers of Disabled staff reporting harassment, bullying and abuse
- 2.6% increase in Disabled staff reporting that they have equal opportunities for career progression or promotion to 58.1%
- 1.8% increase in Disabled staff reporting presenteeism to 18.6%
- 3% increase in Disabled staff feeling valued
- 1.5% increase in Disabled staff reporting that they have reasonable adjustments to 78.8%
- 0.12 increase in Disabled staff engagement score to 6.82
- 6.24% representation of Disabled employees on the Board
Table of indicators
| Label | 2019 | 2020 | 2021 | 2022 | 2023 | 2024 | ||
|---|---|---|---|---|---|---|---|---|
| 1 | Declaration rate | Disabled | 5.40% | 5.40% | 6.00% | 7.00% | 7.80% | 8.60% |
| 2 | Recruitment | 0.88 | 1.35 | 1.18 |
1.15 |
1.16 | 1.28 | |
| 3 | Capability | 2.54 | 2.23 | 1.95 | 1.27 | 1.3 | 4.22 | |
| 4a | Harassment, bullying or abuse managers | Disabled | 43.60% | 38.53% | 31.05% | 38.83% | 34.19% | 28.92% |
| Non-disabled | 23.20% | 26.94% | 24.53% | 25.58% | 25.37% | 21.79% | ||
| Difference | 20.40% | 11.59% | 6.52% | 13.25% | 8.82% | 7.13% | ||
| 4b | Harassment, bullying or abuse colleagues | Disabled | 24.80% | 18.00% | 13.88% | 12.04% | 10.78% | 10.42% |
| Non-disabled | 11.20% | 9.51% | 7.05% | 6.23% | 6.71% | 6.19% | ||
| Difference | 13.60% | 8.49% | 6.83% | 5.81% | 4.07% | 4.23% | ||
| 4c | Harassment, bullying or abuse reporting | Disabled | 44.60% | 54.17% | 58.28% | 55.56% | 63.45% | 61.01% |
| Non-disabled | 55.90% | 52.04% | 60.85% | 59.82% | 57.07% | 63.83% | ||
| Difference | -11.30% | 2.13% | -2.57% | -4.26% | 6.38% | -2.82% | ||
| 5 | Career development | Disabled | 40.60% | 51.25% | 55.63% | 52.14% | 55.47% | 58.09% |
| Non-disabled | 52.20% | 54.99% | 57.14% | 60.23% | 60.39% | 65.05% | ||
| Difference | -11.60% | -3.74% | -1.51% | -8.09% | -4.92% | -6.96% | ||
| 6 | Presenteesim | Disabled | 29.50% | 24.85% | 23.08% | 20.47% | 16.82% | 18.58% |
| Non-disabled | 17.90% | 16.22% | 18.41% | 13.96% | 11.37% | 11.26% | ||
| Difference | 11.60% | 8.63% | 4.67% | 6.51% | 5.45% | 7.32% | ||
| 7 | Feeling valued | Disabled | 33.30% | 38.41% | 41.23% | 41.84% | 41.40% | 44.44% |
| Non-disabled | 43.40% | 44.18% | 50.24% | 48.67% | 49.51% | 55.58% | ||
| Difference |
-10.10% |
-5.77% | -9.01% | -6.83% | -8.11% | -11.14% | ||
| 8 | Workplace adjustments | Disabled | 71.00% | 74% | 78.90% | 74.00% | 77.32% | 78.81% |
| 9 | Staff engagement | Disabled | 6.2 | 6.5 | 6.7 | 6.7 | 6.7 | 6.8 |
| Non-disabled | 6.9 | 6.9 | 7.1 | 7.1 | 7.1 | 7.3 | ||
| Difference | -0.7 | -0.4 | -0.4 | -0.4 | -0.4 | -0.5 | ||
| 10 | Board membership | Disabled | 0% | 0% | 0% | 0% | 0% | 6.25% |
Metric 1 – Percentage of staff who class themselves as having a disability or not
The Trust has seen an increase of 0.6% to 8.6% in 2024 in staff sharing their disability status on ESR (Electronic Staff Records). This is higher than the national WDES 2023 data of 4.9%. On the 2023 NHS Staff Survey, 32.1% of LSCft staff report having a long-term condition, slightly higher than the national NHS Staff Survey average of 30.2%. The Department of Work and Pensions reported in 2023 that one in five of the working-age population are disabled.
Whilst this data shows a positive trend in terms of an increase in Disabled staff and/or an increase of staff reporting a disability, work must continue to create psychological safety for staff to share their disability status, to understand the definition as per the Equality Act and support to navigate ESR to update their disability status should they acquire a disability.
Table 1 LSCft network representation
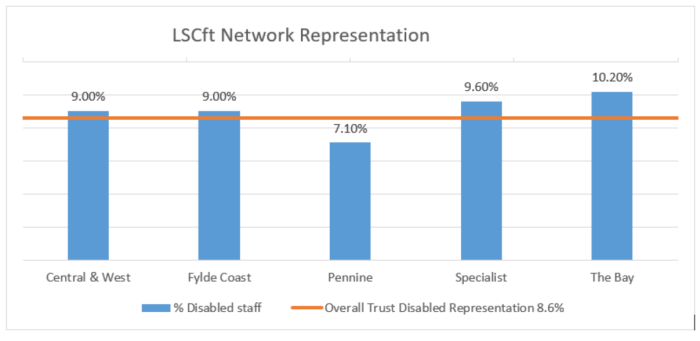
Table 2 disability type
Table 2 represents disability by type in relation to the options provided by ESR and it shows a large amount of clinical staff declaring that they have a learning disability/difficulty. As the numbers of people with a learning disability in paid employment are low (4.8% Nuffield Trust 2021/22) and Royal College of Nursing states that, “neurodivergent groups may be more highly represented in health and social care than the general population”, it may be a reasonable assumption that this population are neurodiverse.
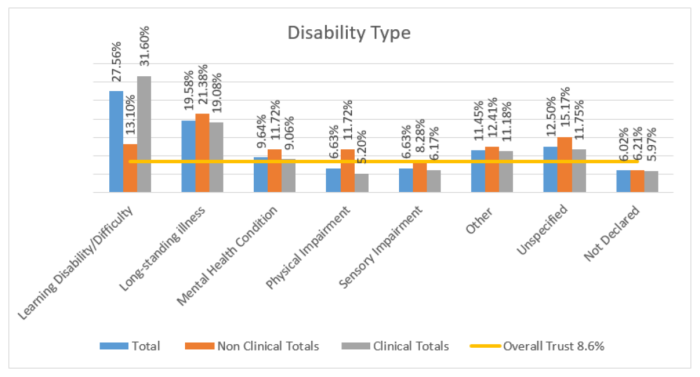
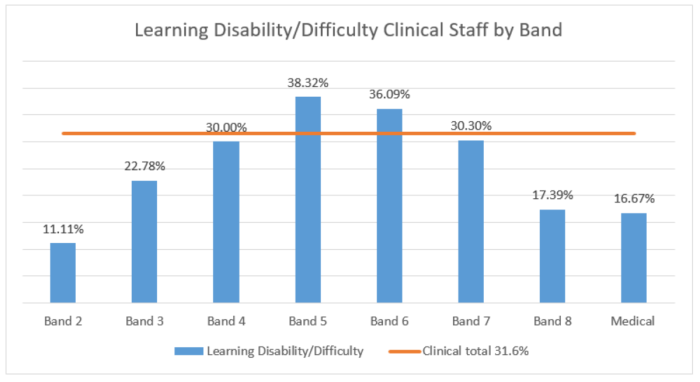
Table 3 learning disability/difficulty clinical staff by band
Table 3 shows a high representation of clinical staff at bands 6 and 7 who identify as having a learning disability/difficulty. Highlighting the need to provide support for LSCft’s neurodiverse workforce and managers, particularly for newly qualified clinicians. Currently, Lancashire and South Cumbria NHS Foundation Trust (LSCft) incorporates neurodiversity awareness into reasonable adjustment training and the Dyslexia and Neurodiverse Staff Network provides input into key areas of work such as staff passports and relevant policies, whilst providing peer support. Last year the network hosted an ADHD awareness session with a panel which included an ADHD charity CEO, consultant and staff member with lived experience.
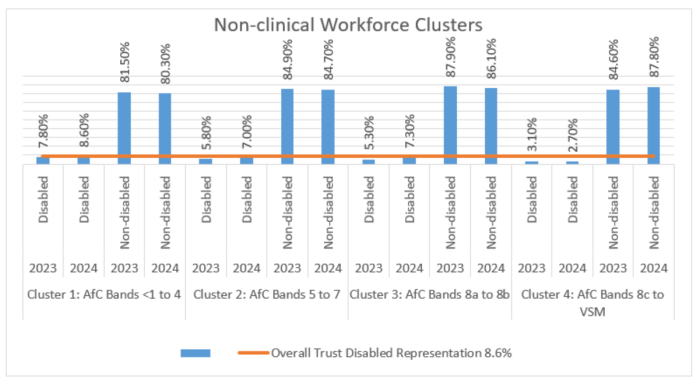
Tables 4a and 4b show the representation of Disabled and non-disabled staff clustered in terms of pay bands and clinical or non-clinical. It highlights a lack of representation of Disabled staff at band 8c or higher in the non-clinical workforce and band 8a or higher in the clinical workforce. Most clusters saw a slight increase in terms of Disabled staff except non-clinical which saw a slight drop.
In 2022/23 LSCft was successful in a WDES funding bid to support the development and progression of disabled staff. The ‘Hidden Talents’ pilot trained facilitators (many of whom were Disabled) to have one-off career conversations with Disabled staff. The pilot highlighted the direct link between psychological safety and likelihood of seeking out development opportunities. A competency matrix across a range of key inclusion areas including disability and neurodiversity is being developed as a benchmarking tool with the aim of broadening the knowledge of LSCft’s internal coaches.
Table 4a clinical workforce clusters
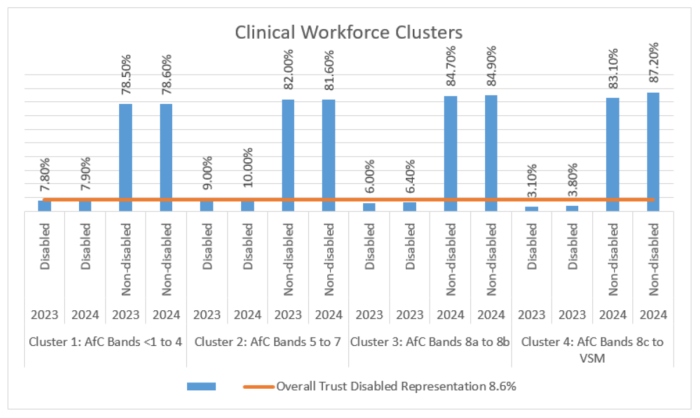
Table 4b non-clinical workforce clusters
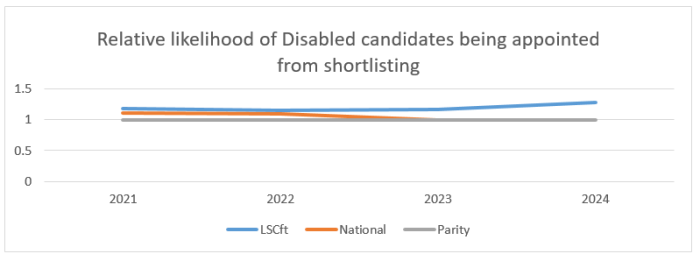
Metric 2 – Relative likelihood of Disabled candidates being appointed from shortlisting
The relative likelihood of Disabled candidates being appointed from shortlisting has worsened to 1.28 from 1.16. The National WDES data for 2023 showed this data set at 0.99, slightly below parity (Table 5).
LSCft’s Recruitment Managers Toolkit was launched in 2020 with the aim of reducing systemic barriers in the recruitment process experienced by minority groups. Whilst the uptake and awareness of the toolkit has increased, good practice recommendations are still not being consistently implemented.
In September 2024 the toolkit is being refreshed and relaunched with a focus on recruitment champions being part of interview panels, questions routinely being given prior to the interview and an audit of usage to assess uptake, awareness and accountability.
Metric 3 – Relative likelihood of Disabled staff entering formal capability process
The relative likelihood of Disabled staff entering a formal capability process has worsened considerably from 1.3 to 4.2 in 2024. However, it is important to note for this data set the numbers involved are very low. The total number of staff involved in a formal capability process over a two year period were eight, making the average number of Disabled staff in the process two, non-disabled 4.5 and unknown 1.5.
The national WDES data in 2023 showed Disabled staff were 2.17 more likely to be in formal capability process.
The Diversity and Inclusion Team continue to work closely with HR in relation to cases that have an equality element.
Staff experience metrics
The following metrics are taken from the 2023 staff survey results, which form the staff experience indicators of the WDES. LSCft is committed to becoming a disability positive organisation and over the last year has listened to the voice of the Disability and Long Term Conditions and Dyslexia and Neurodiverse Staff Network members to understand their lived realities at LSCft. These experiences informed the decision to move towards adopting a centralised process and budget for managing the procurement of reasonable adjustments, recognising that this aspect is fundamental to improving all other WDES metrics.
In terms of bullying and harassment of Disabled staff the development and implementation of policy has been a focus for 23/24 alongside processes for early intervention. LSCft now have a clear Bullying and Harassment Policy in place with clear expectations in regards to zero tolerance to all forms of discrimination. There is also an in-house mediation service with diversity amongst the trained mediators to support complex conversations.
Additionally for the first year LSCft has analysed the experiences of ethnic minority Disabled staff. Appendices 1 show that a higher than Trust average amount of Disabled Indian staff experience harassment, bullying and abuse from the public (38.5% compared to 28.9%) and have felt under pressure to come into work (42.1% compare to 18.6%). Staff from both Indian and Pakistani groups both report less than the Trust Disabled staff average that the organisation provides equal opportunities for career progression. Neither group stated that they reported harassment bullying and abuse and there were no responses from staff of any other ethnicity.
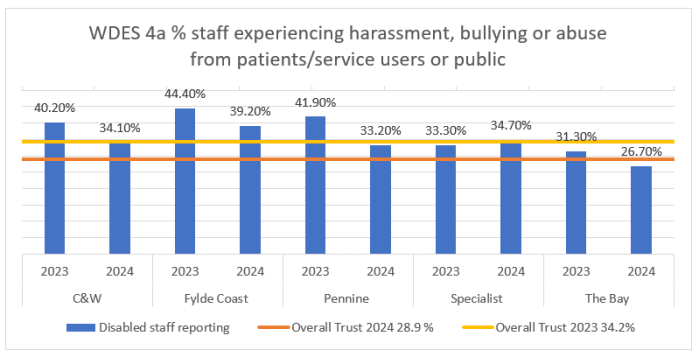
Metric 4a – Percentage of staff experiencing harassment, bullying or abuse from patients, relatives or the public in last 12 months
28.9% of Disabled staff within LSCft reported experiencing harassment, bullying or abuse from patients, relatives or the public in last 12 months this is a decrease (34.2%) compared to last year. This compares to 21.8% of non-disabled staff and the gap has narrowed (1.69%) between the two groups. All organisational networks have seen an improvement on data for Metric 4a except Specialist who have seen a slight worsening.
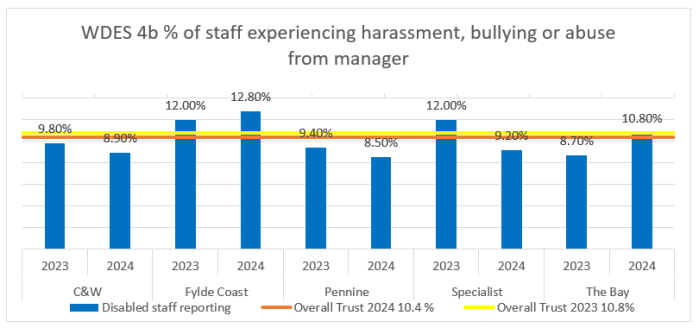
Metric 4b – Percentage of staff experiencing harassment, bullying or abuse from managers in last 12 months
10.4% of Disabled staff within LSCft reported experiencing harassment, bullying or abuse from managers in last 12 months this is a slight decrease (10.8%) compared to last year. This compares to 6.2% of non-disabled staff and the gap has narrowed between the two groups.
Central and West, Pennine and Specialist networks have seen an improvement on this metric. Fylde Coast and The Bay networks have seen a worsening of data for Metric 4b.
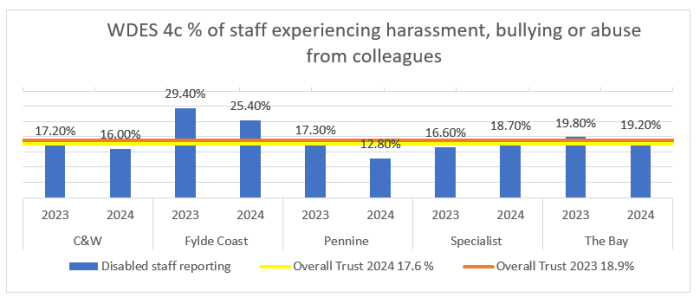
Metric 4c – Percentage of staff experiencing harassment, bullying or abuse from colleagues in last 12 months
17.7% of Disabled staff within LSCft reported experiencing harassment, bullying or abuse from colleagues in the last 12 months, this is a decrease (19%) compared to last year. This compares to 10.4% of non-disabled staff and the gap has widened between the two groups.
Central and West, Pennine and The Bay networks have seen an improvement on this metric, as have the Fylde Coast, however this network is still well above the Trust average. Specialist network have seen a slight worsening of data for Metric 4c.
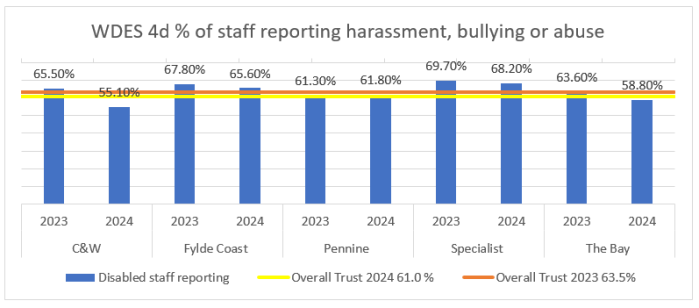
Metric 4d – Percentage of staff saying they, or a colleague, reported harassment, bullying or abuse
61% of Disabled staff within LSCft reported harassment, bullying or abuse in the last 12 months this is a decrease (63.5%) compared to last year. This compares to 63.8% of non-disabled staff and the gap has widened between the two groups.
All networks except Pennine have seen a slight worsening of data for Metric 4d.
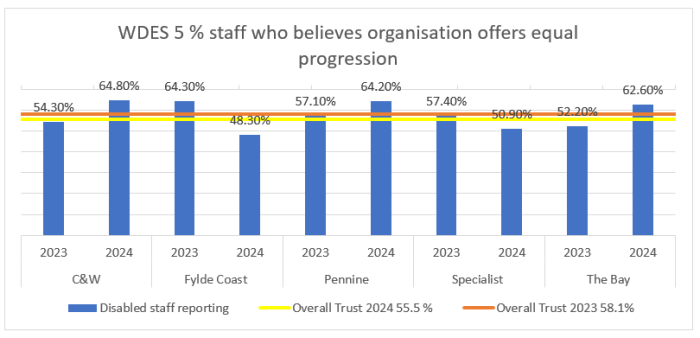
Metric 5 – Percentage of staff who believe that the organisation provides equal opportunities for career progression / promotion
58.1% of Disabled staff within LSCft believe that the Trust provides equal opportunities for career progression and promotion this is an increase (55.5%) compared to last year. This compares to 65% of non-disabled staff and the gap has widened between the two groups.
Central and West, Pennine and The Bay have seen an improvement in this data. Fylde Coast and Specialist have seen a worsening of data for Metric 5.
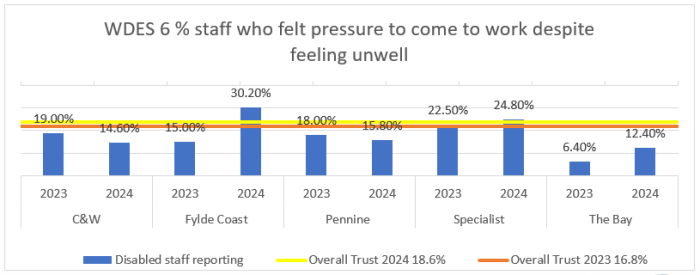
Metric 6 – Percentage of staff who have felt pressure from their manager to come to work despite not feeling well enough to perform duties
18.6% of Disabled staff within LSCft reported feeling under pressure from their manager to come to work despite being unwell this is an increase (16.8%) compared to last year. This compares to 11.3% of non-disabled staff and the gap has widened between the two groups.
Central and West, Pennine and The Bay have seen an improvement in this data. Fylde Coast and Specialist have seen a worsening of data for Metric 6.
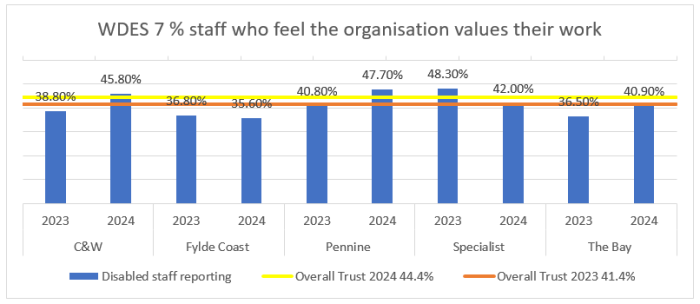
Metric 7 – Percentage of staff satisfied with the extent to which their organisation values their work
44.4% of Disabled staff within LSCft reported feeling satisfied with the extent to which the organisation values their work this is an increase (41.4%) compared to last year. This compares to 55.6% of non-disabled staff and the gap has widened between the two groups.
Central and West, Pennine and The Bay have seen an improvement in this data. Fylde Coast and Specialist have seen a worsening of data for Metric 7.
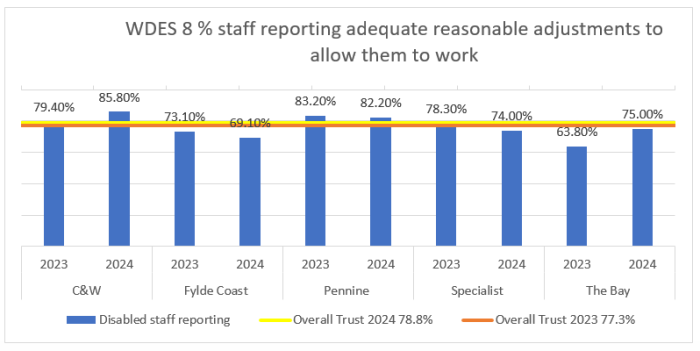
Metric 8 – Percentage of disabled staff who said their employer has made adequate adjustments to enable them to carry out their work
78.8% of Disabled staff within LSCft reported having adequate reasonable adjustments to allow them to work this is an increase (77.3%) compared to last year.
Central and West, Pennine and The Bay have seen an improvement in this data. Fylde Coast and Specialist have seen a worsening of data for Metric 8.
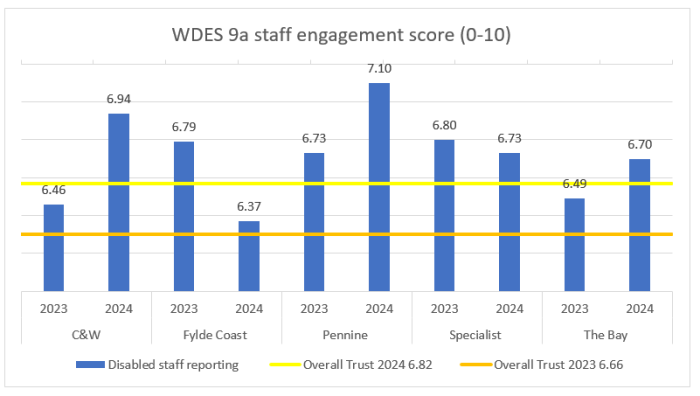
Metric 9 – Staff engagement score
6.82 of Disabled staff within LSCft reported feeling engaged this is an increase (6.7) compared to last years. This compares to 7.3 of non-disabled staff and the gap has widened between the two groups.
Central and West, Pennine and The Bay have seen an improvement in this data. Fylde Coast and Specialist have seen a worsening of Metric 9a.
Metric 10 – Board and Executive Team who class themselves as having a disability
For the first time in five years, the WDES can report having a Board member who class themselves as having a disability.
Benchmarking against national WDES data
Appendices 2 highlights that the majority of data for LSCft’s WDES metrics compare favourably to national WDES 2023 data, except the recruitment and capability metric.
Risks
The indicators that will form the priorities of 24/25 based on detriment, aligned to national plans are as follows:
High risk
|
No |
Description |
Alignment |
|---|---|---|
|
2 |
Relative likelihood of Disabled applicants to be appointed over non-disabled applicants from shortlisting |
High Impact Action 2 NHS Long-term workforce plan- Train |
|
3 |
Relative likelihood of Disabled staff entering formal capability process |
High Impact Action 6 NHS Long-term workforce plan - Retain
|
Conclusion
The 2024 WDES metrics have seen good progress and highlight the commitment that LSCft has made towards becoming Disability Positive.
The Trust set a two-year WDES objective in 2023, ‘To develop a disability positive culture: enabling reasonable adjustments to support colleagues with a disability or long term condition to thrive at LSCft’.
This objective reflected the crucial importance of procuring reasonable adjustments in timely manner, not only to meet legislative requirements, but to foster a disability positive culture where disabled staff feel valued, psychologically safe and have equal access to opportunities.
In September 2024 LSCft will adopt a centralised process for managing Access to Work (Department of Work and Pensions grant programme for disabled people accessing and in employment) recommendations. A permanent resource has been allocated to this work and will oversee the setting up of a function that will not only assist Disabled staff but free managers from navigating a time-consuming and complex process.
The Trust plans to move to centralised fund for reasonable adjustments in April 2025 recognising this as best practice for effective procurement and as good practice for Disabled colleagues who may feel a ‘burden’ upon their team.
Reasonable adjustments have been the main focus of work for 2023/24, however, work has continued in terms of the expansion of the Hidden Talents career conversation programme for Disabled staff and September 2024 will see a relaunch of the Recruitment Manager’s Toolkit which aims to embed inclusive recruitment as standard practice at LSCft.
The data breakdown in terms of ‘disability type’ highlights the need to apply a neurodiverse lens to all areas of work when considering the recruitment, development and support of staff.
Additionally, the breakdown of Disability in terms of ethnicity from the NHS Staff survey highlights the need to ensure that ethnic minority Disabled staff feel confident in terms of reporting harassment, bullying and abuse, are represented in the Disabled staff networks and work to understand barriers that may exist in terms of declaring a disability for minority ethnic staff (particularly staff from an African and Caribbean background).
Recommendations
The Board is asked to read this report for approval and take into account any escalations.