
Declaration rate
- We aim to increase the representation of disabled staff within the organisation.
- This data is sourced from the Electronic Staff Record (ESR) and excludes bank staff.
- Declaration rates have steadily risen over the past five years, from 6.00% in 2021 to 10.50% in 2025. This represents a 1.90% increase compared to last year (2024: 8.60%).
- The upward trend in declarations may suggest that staff feel more comfortable disclosing their disability status to the Trust.
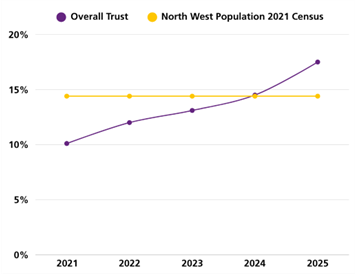
Declaration rate graph description: A line graph comparing "Overall Trust" with the "North West Population 2021 Census" of the representation of disabled staff from 2021 to 2025. The y-axis shows percentages from 0% to 20%. The x-axis covers the years 2021 to 2025. The purple line represents "Overall Trust," which rises steadily from 10% in 2021 to around 17% in 2025. The yellow line represents the "North West Population 2021 Census," remaining constant at about 14.5% across all years. By 2024, "Overall Trust" nearly matches the census line and surpasses it in 2025.
Recruitment
- Our goal for this metric is to achieve a value close to 1.00, which indicates equal shortlisting opportunities for disabled and non-disabled candidates.
- The data is drawn from TRAC and excludes bank staff.
- The metric has improved from 1.28 in 2024 to 1.19 in 2025, indicating that disabled candidates are now 19% less likely to be shortlisted than their non-disabled counterparts - a reduction in disparity.
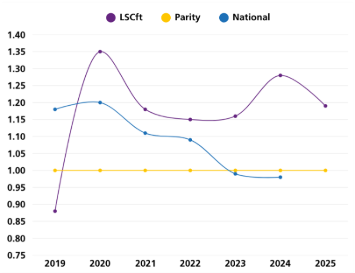
Recruitment graph description: A line graph from 2019 to 2025 comparing LSCft, Parity, and National values in relation to shortlisting opportunities for disabled and non-disabled candidates. The y-axis ranges from 0.75 to 1.40. The purple line (LSCft) starts at about 0.88 in 2019, peaks at 1.35 in 2020, dips to around 1.15 in 2021–2022, rises again to about 1.28 in 2024, then drops slightly to 1.19 in 2025. The blue line (National) begins at 1.18 in 2019, peaks at 1.20 in 2020, steadily declines to 0.98 by 2023, and remains around 0.98–0.99 through 2025. The yellow line (Parity) stays constant at 1.00 across all years.
Presenteeism
- We aim to reduce the percentage of disabled staff who feel pressured to attend work when unwell.
- This data is taken from the National Staff Survey (NSS) 2024 staff survey and excludes bank staff.
- The rate of presenteeism has steadily declined over the past five years, from 23.08% in 2021 to 16.44% in 2025 - a 2.14% decrease from last year (2024: 18.58%). Additionally, the gap between disabled and non-disabled staff has narrowed significantly, falling from 7.32% to 3.54%.
- This reduction may indicate that disabled staff are receiving appropriate workplace adjustments that support their well-being.
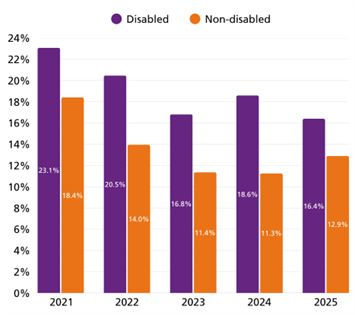
Presenteeism graph description: A bar graph comparing the percentage of disabled and non-disabled individuals from 2021 to 2025 who felt pressured to attend work when unwell. The purple bars represent disabled individuals, and the orange bars represent non-disabled individuals. In 2021, the percentages are 23.1% for disabled and 18.4% for non-disabled. In 2022, the percentages are 20.5% for disabled and 14.0% for non-disabled. In 2023, the percentages are 16.8% for disabled and 11.4% for non-disabled. In 2024, the percentages are 18.6% for disabled and 11.3% for non-disabled. In 2025, the percentages are 16.4% for disabled and 12.9% for non-disabled. The x-axis shows the years, and the y-axis shows percentage values from 0% to 24%.
Harassment, bullying or abuse: reporting
- We aim to increase the percentage of staff who report incidents of bullying, harassment, or discrimination related to disability, whether experienced personally or witnessed.
- This data is sourced from the NSS 2024 staff survey and excludes bank staff.
- The reporting rate has fluctuated over the past five years and has declined for the second consecutive year, from 63.45% in 2023 to 61.01% in 2024.
- The gap between disabled and non-disabled staff has remained relatively stable, though it has worsened slightly by 0.90%.
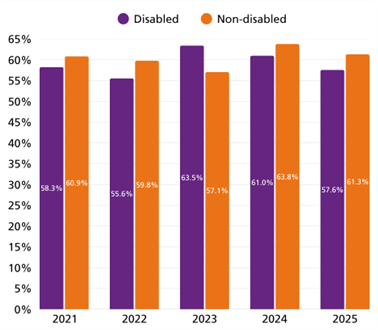
Harassment, bullying or abuse reporting graph description: A bar graph comparing rates of disabled and non-disabled individuals from 2021 to 2025 who reported incidents of bullying, harassment or discrimination related to disability. Purple bars represent disabled individuals, and orange bars represent non-disabled individuals. The employment rates are: 2021: Disabled – 58.3%, Non-disabled – 60.9%, 2022: Disabled – 55.6%, Non-disabled – 59.8%, 2023: Disabled – 57.1%, Non-disabled – 63.5%, 2024: Disabled – 61.0%, Non-disabled – 63.8%, 2025: Disabled – 57.6%, Non-disabled – 61.3%.
Career development
- We aim to increase the percentage of disabled staff who feel there are opportunities for career progression.
- This data is drawn from the NSS 2024 staff survey and excludes bank staff.
- The metric has varied slightly over the past five years and has decreased from 58.09% in 2024 to 54.28% in 2025.
- The gap between disabled and non-disabled staff has remained largely unchanged, with a marginal increase of 0.05%.

Career development graph description: Bar graph showing rates of disabled and non-disabled individuals who feel there are opportunities for career progression from 2021 to 2025. The x-axis represents years; the y-axis shows percentages from 0% to 70%. Each year includes two bars: purple for disabled individuals and orange for non-disabled individuals. Rates for disabled individuals are: 55.6% (2021), 52.1% (2022), 55.5% (2023), 58.1% (2024). For non-disabled individuals: 57.1% (2021), 60.2% (2022), 60.4% (2023), 65.1% (2024). 2025 data is projected but not specified.
Capability
- We aim to achieve a metric value close to 1.00, indicating equal likelihood of entering the formal disciplinary process for disabled and non-disabled staff.
- This data is sourced from HR records, excluding bank staff and cases related to ill health. The metric is calculated using a two-year rolling average.
- A significant deterioration has occurred, with the value rising from 1.95 in 2024 to 9.90 in 2025. It is important to note, however, that the data pool for this metric is extremely small, comprising only 19 formal cases over the past two years. Of these, 7 involved non-disabled staff, 3 did not specify a disability status, and 9 involved disabled staff.
- Due to the small sample size, the data is vulnerable to skewing, meaning even minor changes can distort trends - this may lead to misleading conclusions, particularly as disabled staff appear disproportionately represented in capability procedures, raising concerns about potentially discriminatory application of Trust policies.
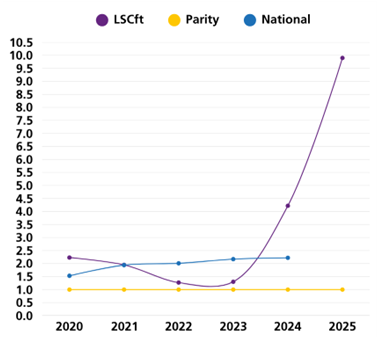
Capability graph description: Line graph showing trends from 2020 to 2025 of disabled and non-disabled staff's likelihood of entering formal disciplinary process. LSCft (purple), Parity (yellow), and National (blue). The y-axis ranges from 0.0 to 10.5; the x-axis shows years 2020 to 2025. The LSCft line starts at ~2.0 in 2020, dips below 1.5 in 2022–2023, then rises sharply to ~10.0 by 2025. The Parity line remains flat at ~1.0 throughout. The National line fluctuates between ~1.4 and ~2.3, with a slight upward trend.
Harassment, bullying or abuse: colleagues
- We aim to reduce the percentage of disabled staff who report experiencing bullying, harassment, or discrimination from colleagues within the past 12 months.
- This data is taken from the NSS 2024 staff survey and excludes bank staff.
- Although the metric declined from 2022 to 2024, it has increased this year from 17.64% to 19.61%.
- Furthermore, the gap between disabled and non-disabled staff has widened for the third consecutive year, increasing by 1.95%.
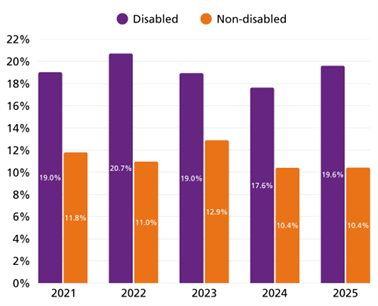
Harassment, bullying or abuse from colleagues graph description: Bar graph showing the percentage of disabled and non-disabled individuals from 2021 to 2025 who reported experiencing bullying, harassment or discrimination from colleagues in the past 12 months. The x-axis represents years; the y-axis shows percentages from 0% to 22%. Each year includes two bars: purple for disabled individuals and orange for non-disabled individuals. Percentages for disabled individuals are: 19.0% (2021), 20.7% (2022), 19.0% (2023), 17.6% (2024), and 19.6% (2025). Percentages for non-disabled individuals are: 11.8% (2021), 11.0% (2022), 12.9% (2023), 10.4% (2024), and 10.4% (2025).
Staff engagement
- We aim to improve engagement scores among disabled staff, as measured by the annual staff survey (scale of 1 to 10).
- This data is taken from the NSS 2024 staff survey and excludes bank staff.
- The score has declined from 6.8 to 6.2, and the gap between disabled and non-disabled staff engagement scores has reached its highest level since 2019, with a full 1 point difference.
- This may suggest that disabled staff do not view the survey as an effective platform for sharing their experiences.
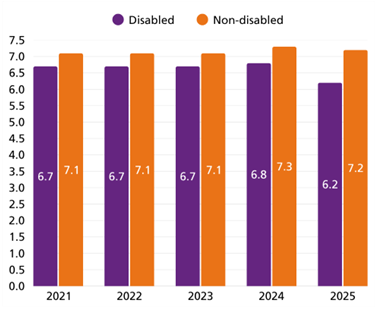
Staff engagement graph description: Bar graph showing average scores of engagement of disabled and non-disabled individuals from 2021 to 2025. The x-axis represents years; the y-axis shows scores from 0 to 7.5. Each year includes two bars: purple for disabled individuals and orange for non-disabled individuals. Scores for disabled individuals are: 6.7 (2021), 6.7 (2022), 6.7 (2023), 6.8 (2024), and 6.2 (2025). Scores for non-disabled individuals are: 7.1 (2021), 7.1 (2022), 7.1 (2023), 7.3 (2024), and 7.2 (2025).