
Harassment, bullying or abuse: colleagues
- We aim to reduce the number of Black and Minority Ethnic (BME) bank staff experiencing bullying, harassment, or abuse from colleagues.
- According to the National Staff Survey (NSS) 2024, 34.3% of BME bank staff at LSCFT reported such experiences, representing a decrease from 40.0% the previous year.
- Encouragingly, the gap between the experiences of BME and White bank staff has narrowed, which may indicate progress in fostering a more inclusive and equitable working environment for bank staff.
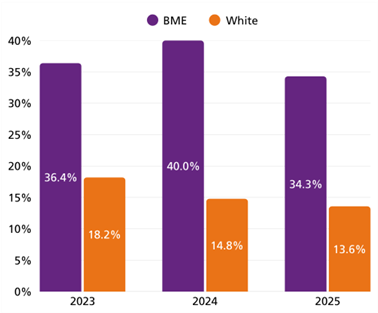
Harassment, bullying or abuse colleagues graph description: Bar graph comparing the percentage of Black and Minority Ethnic (BME) and White individuals from 2023 to 2025 who experienced bullying or harassment or abuse from colleagues. The x-axis shows years; the y-axis ranges from 0% to 40%. Each year includes two bars: purple for BME and orange for White. Percentages for BME individuals are: 36.4% (2023), 40.0% (2024), and 34.3% (2025). Percentages for White individuals are: 18.2% (2023), 14.8% (2024), and 13.6% (2025).
Permanent employment at this organisation
- We aim to increase the number of BME bank staff considering a transition to permanent employment within the organisation.
- Overall, 48.6% of bank staff expressed interest in permanent roles, with 32.7% of BME bank-only staff indicating they would consider such a move.
- However, there has been a notable decline in the proportion of White bank staff expressing similar interest, which has widened the gap between BME and White staff in this area.
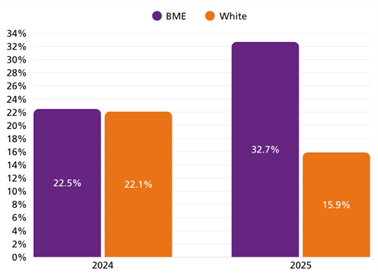
Permanent employment at this organisation graph description: Bar graph comparing the percentages of Black and Minority Ethnic (BME) and White individuals considering permanent employment with the Trust for the years 2024 and 2025. The x-axis shows the years; the y-axis represents percentage values. Purple bars represent BME individuals, and orange bars represent White individuals. In 2024, BME is at 22.5% and White is at 22.1%. In 2025, BME increases to 32.7%, while White decreases to 15.9%.
Discrimination at work: colleagues and managers
- We are aiming to reduce incidents of direct discrimination experienced by BME bank staff from colleagues and managers.
- In the NSS 2024, 26.9% of BME bank staff reported experiencing such discrimination, a decrease from 30.4% the previous year.
- This reduction, along with a narrowing gap between BME and White bank staff, could suggest an improvement in bank workers' experience from their colleagues/managers across the organisation.

Discrimination at work from colleagues and managers graph description: Bar graph comparing the percentage of Black and Minority Ethnic (BME) and White individuals from 2023 to 2025 who experienced discrimination at work from colleagues or managers. The x-axis shows the years; the y-axis ranges from 0% to 36%. Each year includes two bars: purple for BME and orange for White. Percentages for BME individuals are: 35.1% (2023), 34.0% (2024), and 26.9% (2025). Percentages for White individuals are: 9.4% (2023), 6.6% (2024), and 9.7% (2025).
Permanent employment at another organisation
- We aim to reduce the number of BME bank staff considering permanent employment at other NHS organisations.
- Derived from the NSS 2024, currently, 5.1% of BME bank-only staff indicated they would consider such a move, reflecting a slight increase.
- However, a notable decline in the number of White bank staff expressing this intention has narrowed the gap between the two groups.
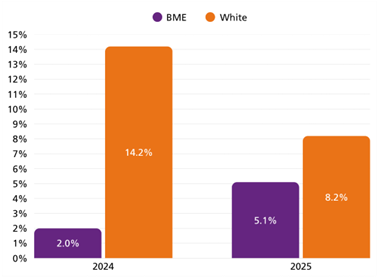
Permanent employment at another organisation graph description: Bar graph comparing the percentages of Black and Minority Ethnic (BME) and White individuals for the years 2024 and 2025 who are considering permanent employment at another organisation. The x-axis shows the years; the y-axis ranges from 0% to 15%. In 2024, the purple bar for BME is at 2.0%, and the orange bar for White is at 14.2%. In 2025, the purple bar for BME rises to 5.1%, while the orange bar for White decreases to 8.2%.
Disciplinary
- We aim to reduce the likelihood of BME bank staff entering the formal disciplinary process compared to their White counterparts, with a value of 1.00 considered parity, indicating equal likelihood of dismissal between the two groups.
- According to HR records, BME bank staff at LSCFT are currently twice as likely (2.00) to enter formal disciplinary proceedings compared to White bank staff.
- This represents a deterioration from the previous year’s figure of 1.73 and highlights the need for targeted action to address this disparity.
- However, when analysing the outcomes of the disciplinary process, there has been a positive shift and BME bank staff are now only slightly more likely to be dismissed than White bank staff, with the dismissal outcome metric improving from 2.00 to 1.08.
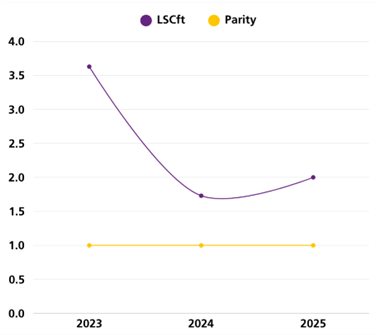
Disciplinary graph description: Line graph comparing LSCFT BME colleagues entering the disciplinary process (purple) and Parity (yellow), from 2023 to 2025. The x-axis shows years; the y-axis ranges from 0.0 to 4.0. The LSCft line starts at ~3.6 in 2023, dips to ~1.7 in 2024, and rises slightly to ~2.1 in 2025. The Parity line remains flat at 1.0 across all three years.
BME experience: public
- We aim to reduce the number of BME bank staff experiencing negative behaviour from the public, service users, and their families or friends. The NSS 2024 data shows:
- 63.9% of BME bank staff reported experiencing harassment, bullying, or abuse (up from 45.3%),
- 58.5% reported experiencing physical violence (up from 44.2%),
- 53.2% reported experiencing direct discrimination (up from 44.2%).
- These increases are significant and have widened the gap between the experiences of BME and White bank staff, which may indicate a need for intervention and support.
BME experience: at work
- We aim to improve the overall workplace experience for BME bank staff. According to the NSS 2024:
- 89.47% of BME bank staff who experienced physical violence at work reported the incident, a 6% decrease from the previous year.
- 40.2% of BME bank staff felt there were opportunities for career development within the organisation, a significant drop from 76.9% the previous year.
- 68.9% of BME bank staff felt they received the respect they deserved from colleagues, a 6% decrease from the previous year.
- In contrast, the experiences of White bank staff in these areas have either improved or remained stable, which may highlight a growing disparity.