
Trust average hourly rate
- The average (mean) gender pay gap across the overall workforce has widened slightly, increasing from 9.1% to 10% in favour of male staff. However, when focusing specifically on Agenda for Change (AfC) staff, the gap has narrowed, improving from 1.0% to 0.4%.
- In terms of the median pay gap, the overall workforce saw a shift from -0.2% to -0.5%, indicating a growing pay advantage for female staff. Among AfC staff, the median gap changed from -3.8% to -2.5%, showing a slight reduction in the pay advantage previously held by female staff.

Trust average hourly rate graph description: Bar graph comparing average and median hourly rates between males and females. The y-axis ranges from £0 to £25. The x-axis includes two categories: 'Avg. Hourly Rate' and 'Median Hourly Rate'. In the 'Avg. Hourly Rate' category, males earn £22.43 (orange bar) and females earn £20.18 (purple bar). In the 'Median Hourly Rate' category, males earn £19.00 (orange bar) and females earn £19.09 (purple bar).
Agenda for Change only:
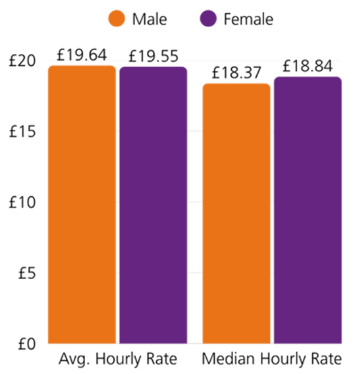
Trust average hourly rate Agenda for Change only graph description: Bar graph comparing average and median hourly rates between males and females on Agenda for Change. Two sets of bars are shown: one for average hourly rate and one for median hourly rate. Each set includes an orange bar for males and a purple bar for females. For average hourly rate, males earn £19.64 and females earn £19.55. For median hourly rate, males earn £18.37 and females earn £18.84. Values are displayed at the top of each bar.
- Lower quartile: male 21%, female 79%. No change observed: the distribution remained consistent.
- Lower middle quartile: male 26.1%, female 73.9%. Improved, with female representation decreasing from 77.7% to 73.3%.
- Upper middle quartile: male 18.9%, female 81.1%. Slight improvement, increasing from 80.7% to 81.1%.
- Upper quartile: male 27.6%, female 72.4%. Deteriorated, with female representation falling from 75.2% to 72.4%.
Trust average hourly rate: BME staff
- The average (mean) ethnicity pay gap across the overall workforce has widened, increasing from 15.4% to 17.2% in favour of male staff from Black and Minority Ethnic (BME) backgrounds.
- However, when focusing solely on Agenda for Change (AfC) staff, the gap has significantly improved, narrowing from 3.1% to just 0.4%.
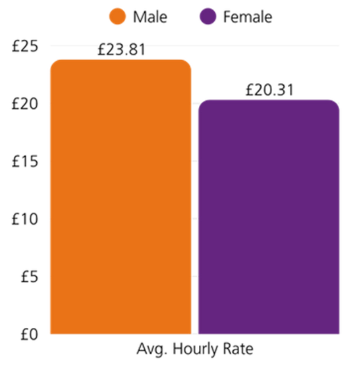
Trust average hourly rate BME staff graph description: Bar graph comparing the average hourly rate between BME males and females. The orange bar represents males with an average hourly rate of £23.81, while the purple bar represents females with an average hourly rate of £20.31. The y-axis ranges from £0 to £25.
Agenda for Change only:
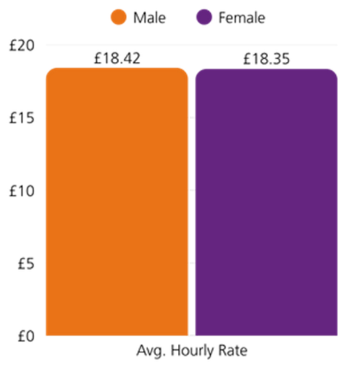
Trust average hourly rate BME AFC only graph description: Bar graph comparing the average hourly rate between males and females on AFC only. The y-axis ranges from £0 to £20. The x-axis represents the average hourly rate. The orange bar for males shows £18.42, and the purple bar for females shows £18.35.
Trust average AFC hourly rate: ethnicity group
- Between 2024 and 2025, the average gender pay gap for AfC female staff showed varied trends across ethnic groups:
- White: Gap widened slightly from 1.9% to 2.2%
- Indian: Gap narrowed significantly from 5.6% to 2.5%
- Pakistani: Gap reduced from 7.3% to 5.3%, though still notable
- African: Gap remained stable, decreasing marginally from 2.5% to 2.4%
White:

Trust average AFC hourly rate ethnicity group white graph description: Bar graph comparing the average hourly rate between white males and females on AFC. The y-axis ranges from £0 to £25 and the x-axis is labeled 'Avg. Hourly Rate'. The orange bar for males shows an average hourly rate of £20.21, and the purple bar for females shows £19.78.
African:

Trust average AFC hourly rate ethnicity group African graph description: Bar graph comparing the average hourly rate between African males and females. The y-axis ranges from £0 to £20 and the x-axis is labelled 'Avg. Hourly Rate'. The orange bar for males shows an average hourly rate of £18.16, and the purple bar for females shows £17.72.
Indian:

Trust average AFC hourly rate ethnicity group Indian graph description: Bar graph comparing the average hourly rate between Indian males and females. The y-axis ranges from £0 to £20 and the x-axis is labelled 'Avg. Hourly Rate'. The orange bar for males shows an average hourly rate of £18.94, and the purple bar for females shows £18.48.
Pakistani:

Trust average AFC hourly rate ethnicity group Pakistani graph description: Bar graph comparing the average hourly rate between Pakistani males and females. The y-axis ranges from £0 to £20 and the x-axis is labelled 'Avg. Hourly Rate'. The orange bar for males shows an average hourly rate of £18.58, and the purple bar for females shows £17.65.
Trust mean hourly rate: ethnicity group
- The most significant gender pay disparity within the non-Agenda for Change (non-AfC) workforce is observed among Indian female colleagues.
- While the overall mean gender pay gap for Indian staff has improved, this progress is largely driven by those employed under AfC terms.
- In contrast, Indian female staff outside the AfC framework continue to experience the largest pay gap compared to their male counterparts.
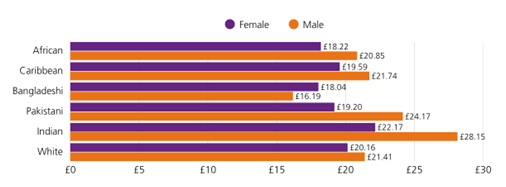
Trust mean hourly rate ethnicity group graph description: Horizontal bar graph comparing median hourly pay between males and females across six ethnic groups. The y-axis lists African, Caribbean, Bangladeshi, Pakistani, Indian, and White. The x-axis ranges from £0 to £30. Purple bars represent females and orange bars represent males. Pay rates are: African – Female £18.22, Male £20.85; Caribbean – Female £19.59, Male £21.74; Bangladeshi – Female £16.19, Male £18.04; Pakistani – Female £19.20, Male £24.17; Indian – Female £22.17, Male £28.15; White – Female £20.16, Male £21.41.
Agenda for Change only:
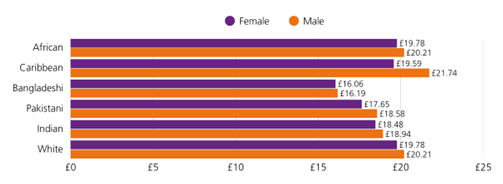
Trust mean hourly rate ethnicity group AFC only graph description: Horizontal bar graph comparing average hourly earnings between males and females on AFC only across six ethnic groups. The x-axis ranges from £0 to £25. The y-axis lists African, Caribbean, Bangladeshi, Pakistani, Indian, and White. Each group has two bars: purple for females and orange for males. Earnings are: African – Female £19.78, Male £20.21; Caribbean – Female £19.59, Male £21.74; Bangladeshi – Female £16.06, Male £16.19; Pakistani – Female £17.65, Male £18.58; Indian – Female £18.48, Male £18.94; White – Female £19.78, Male £20.21.
Bonus pay
- The mean gender pay gap in bonus payments is –33.3%, indicating that, on average, female staff receive higher bonuses than male staff.
- However, the median gender pay gap is 3.8%, suggesting that the middle value of bonus payments is slightly higher for male staff.
- These bonuses relate solely to Clinical Excellence Awards (CEAs), which recognise exceptional performance among consultants.