
Disciplinary
- This metric aims for a value close to 1.00, which would indicate parity in the likelihood of entering the formal disciplinary process between LGBO and heterosexual staff.
- The data is sourced from HR records and excludes bank staff.
- The metric has improved significantly from 2.53 in 2024 to 0.93 in 2025, indicating that LGBO staff are now less likely to enter the formal disciplinary process compared to their heterosexual colleagues.

Disciplinary graph description: Line graph showing two data series from 2023 to 2025 comparing LSCFT LGBO staff likelihood of entering disciplinary against parity. The x-axis shows years; the y-axis ranges from 0.0 to 2.6. The purple line, labelled "LSCft," starts at ~1.8 in 2023, peaks at ~2.5 in 2024, and drops to ~0.9 in 2025. The yellow line, labelled "Parity," remains constant at 1.0 across all three years.
Board membership
- We aim to increase the percentage of LGBO staff represented at the executive level.
- This data is drawn from the Electronic Staff Record (ESR) and excludes bank staff.
- Declaration rates have steadily increased over the past three years, rising from 13.30% in 2023 to 25.00% in 2025. This includes a 6.20% increase from 2024 (18.80%).
- The rise in declaration rates at the board level may suggest improved visibility and representation of LGBO individuals in executive leadership roles.
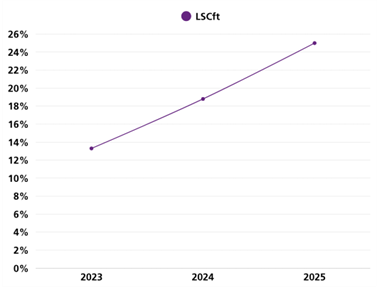
Board membership graph description: A line graph showing the increase in LSCFT Board members identifying as LGBO from 2023 to 2025. Rise from 13.30% in 2023 to 25% in 2025.
Career development
- We aim to increase the percentage of LGBO staff who feel there are opportunities for career progression.
- This data is taken from the NSS 2024 staff survey and excludes bank staff.
- While the overall percentage has declined since last year, the disparity between LGBO and heterosexual staff has improved, narrowing from 10.48% to 5.76%.
- This may suggest that although fewer LGBO staff currently perceive opportunities for progression, efforts to reduce inequality in perception between LGBO and heterosexual staff may be having a positive impact.
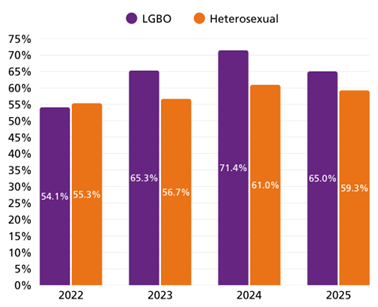
Career progression graph description: Bar graph comparing the percentages of LGBO and Heterosexual individuals from 2022 to 2025 who feel there are opportunities for career progression. The x-axis shows the years; the y-axis ranges from 0% to 75%. Each year includes two bars: purple for LGBO and orange for Heterosexual. LGBO percentages are: 54.1% (2022), 65.3% (2023), 71.4% (2024), and 65.0% (2025). Heterosexual percentages are: 55.3% (2022), 56.7% (2023), 61.0% (2024), and 59.3% (2025).
Harassment, bullying or abuse: public
- For this metric, we hope to see a decrease in the percentage of LGBO staff who have experienced bullying, harassment, and discrimination from the public, service users, family, and friends in the past 12 months.
- This data is sourced from the NSS 2024 staff survey and excludes bank staff.
- The overall percentage has been gradually declining over the past three years for both LGBO and heterosexual staff.
- However, the disparity between the two groups has only shown minor improvement, with the gap remaining relatively consistent over time.
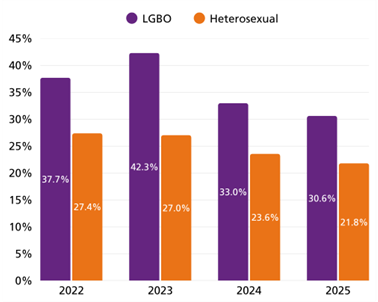
Harassment, bullying or abuse public graph description: Bar graph comparing the percentage of LGBO and Heterosexual individuals from 2022 to 2025 who experienced harassment bullying or abuse from the public. The x-axis shows the years; the y-axis ranges from 0% to 45%. Purple bars represent LGBO individuals, and orange bars represent Heterosexual individuals. LGBO percentages are: 37.7% (2022), 42.3% (2023), 33.0% (2024), and 30.6% (2025). Heterosexual percentages are: 27.4% (2022), 27.0% (2023), 23.6% (2024), and 21.8% (2025).
Target of unwanted sexual behaviour: public
- We aim to reduce the percentage of LGBO staff who report being targeted with unwanted sexual behaviour by members of the public, service users, or their family and friends within the past 12 months.
- According to data from the NSS 2024 staff survey, this figure has shown a slight improvement, decreasing from 17.03% in 2024 to 14.92% in 2025.
- However, the disparity between LGBO and heterosexual staff has only marginally improved, with the gap remaining relatively consistent compared to the previous year.
- When disaggregated by sexual orientation, the highest rates of reported being targeted are among staff identifying as ‘Other’ (23.08%) and ‘Bisexual’ (18.18%), indicating that these groups may be particularly vulnerable to this type of behaviour.
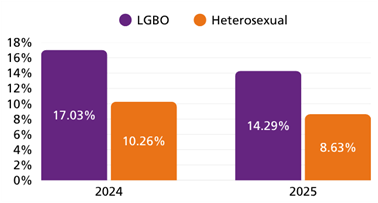
Target of unwanted sexual behaviour public graph description: Bar graph comparing the percentage of LGBO and Heterosexual individuals for the years 2024 and 2025 who experienced unwanted sexual behaviour from the public. The x-axis shows the years; the y-axis represents percentage values. Each year includes two bars: purple for LGBO and orange for Heterosexual. In 2024, LGBO is at 17.03% and Heterosexual is at 10.26%. In 2025, LGBO is at 14.29% and Heterosexual is at 8.63%.
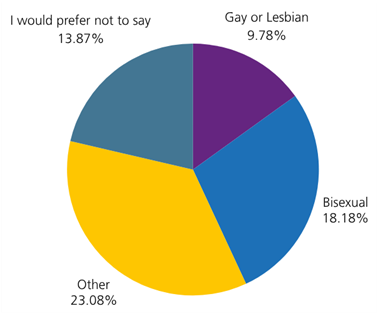
Target of unwanted sexual behaviour public pie chart description: Pie chart showing the distribution of sexual orientations who experienced unwanted sexual behaviour from the public in 2024 and 2025. The chart includes five segments: "I would prefer not to say" (13.87%), "Gay or Lesbian" (9.78%), "Bisexual" (18.18%), and "Other" (23.08%).
Discrimination at work: public
- We aim to reduce the percentage of LGBO staff who report experiencing direct discrimination at work from the public, service users, or their families and friends.
- This data, from the NSS 2024 staff survey and excludes bank staff.
- While the metric had been steadily declining since 2022, it has increased this year.
- Additionally, the disparity between LGBO and heterosexual staff has widened, rising from 2.71% to 5.18%.
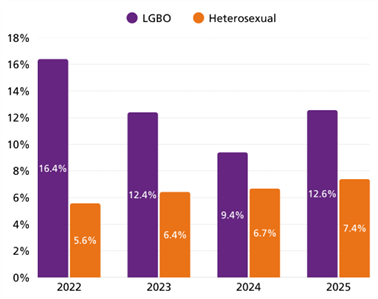
Discrimination at work public graph description: Bar graph comparing the percentage of LGBO and Heterosexual individuals from 2022 to 2025 who experienced discrimination at work. The x-axis shows the years; the y-axis ranges from 0% to 18%. Each year includes two bars: purple for LGBO and orange for Heterosexual. LGBO percentages are: 16.4% (2022), 12.4% (2023), 9.4% (2024), and 12.6% (2025). Heterosexual percentages are: 5.6% (2022), 6.4% (2023), 6.7% (2024), and 7.4% (2025).A graph of different colored bars
Discrimination at work: colleagues
- We aim to reduce the percentage of LGBO staff who report experiencing direct discrimination from colleagues in the past 12 months.
- Based on the NSS 2024 staff survey data, although the trend had been improving since 2022, there has been an increase this year.
- The gap between LGBO and heterosexual staff has also significantly widened, from 0.96% to 4.59%.
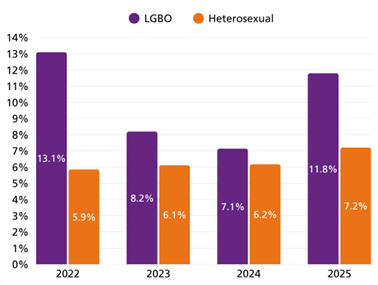
Discrimination at work colleagues graph description: Bar graph comparing the percentage of LGBO and Heterosexual individuals from 2022 to 2025 who experienced discrimination at work from colleagues. The x-axis shows the years; the y-axis ranges from 0% to 14%. Each year includes two bars: purple for LGBO and orange for Heterosexual. LGBO percentages are: 13.1% (2022), 8.2% (2023), 7.1% (2024), and 11.8% (2025). Heterosexual percentages are: 5.9% (2022), 6.1% (2023), 6.2% (2024), and 7.2% (2025).
Target of unwanted sexual behaviour: colleagues
- We aim to reduce the percentage of LGBO staff who report being targeted with unwanted sexual behaviour by colleagues in the past 12 months.
- Based on the data from NSS 2024 staff survey, this figure has worsened, increasing from 3.85% in 2024 to 4.92% in 2025.
- The disparity between LGBO and heterosexual staff has also doubled, rising from 1.39% to 2.96%.
- When disaggregated by sexual orientation, the highest rates of reported being targeted are among staff identifying as ‘Other’ (15.38%) and ‘Gay or Lesbian’ (5.38%), indicating that these groups may be particularly vulnerable to this type of behaviour from colleagues.

Target of unwanted sexual behaviour colleagues graph description: Bar graph comparing the percentages of LGBO and Heterosexual individuals for the years 2024 and 2025 who experienced unwanted sexual behaviour from colleagues. The x-axis shows the years; the y-axis ranges from 0.0% to 5.0%. In 2024, LGBO individuals are represented by a purple bar at 3.85%, and Heterosexual individuals by an orange bar at 2.46%. In 2025, LGBO increases to 4.92%, while Heterosexual decreases to 1.96%.
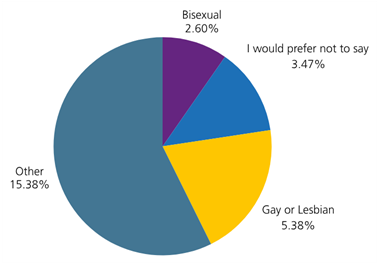
Target of unwanted sexual behaviour colleagues pie chart description: Pie chart showing the distribution of sexual orientations of those who experienced unwanted sexual behaviour from colleagues during 2024 and 2025. The largest segment is "Other" at 15.38% (dark blue), followed by "Gay or Lesbian" at 5.38% (yellow), "I would prefer not to say" at 3.47% (blue), and "Bisexual" at 2.60% (purple).