
We have created four fictional characters that could represent intersectional experiences through their characteristics to demonstrate some of the inequalities and disparities our colleagues may face.
Meet James
- Non-clinical, cluster 4
- White British
- Male
- Gay
- Dyslexic
James can expect to share a similar ethnic background to the majority of other staff members in his cluster (92.31% White); however, he can expect to see twice as many white women (61.1%) in his cluster as men (29.8%).
He can expect to be one of the very few disabled staff (7.69%) in his cluster, and one of the only disabled staff in his cluster with a learning difficulty(11.11%).
He can expect to be one of the only LGBO+ staff in his cluster (8.97%).
Meet Malaika
- Non-clinical, cluster 2
- Black African, British
- Female
- Bisexual
- Deaf in one ear
Malaika can expect to be one of the very few BME women (5.1%) in her cluster and one of the only staff members of her ethnic background within her cluster (3.63%).
She can expect to be one of the few disabled staff (16.67%) in her cluster, but she makes up about a third of her cluster's disabled staff with a physical impairment (32.22%).
She can expect to be one of her cluster's very few LGBO+ staff (3.87%).
Meet Aadhya
- Clinical, cluster 3
- Asian
- Female
- Heterosexual
- Recruited from outside the UK
Aadhya can expect to be one of the very few BME women in her cluster (6.01%) and one of the only staff members of her ethnic background within her cluster (5.53%).
She can expect to be one of the only members of staff internationally recruited for the Trust (2.89%).
She can expect to be one of many non-disabled staff (82.47%) and heterosexual staff (86.78%) in her cluster.
Meet Emma
- Bank only clinical worker, cluster 1
- White British
- Female
- Heterosexual
- Long-term condition: epilepsy
Emma can expect to be in the slight minority of bank members of her ethnic background in her cluster (44.04%); however, she will be in the majority group of white women within her cluster (34.4%).
She can expect to be one of the only disabled staff (3.83%) in her cluster, but she makes up about a third of her cluster’s disabled staff with a long-term condition (28%).
She can expect to be one of many heterosexual staff (86.16%) in her cluster.
Relative likelihood of being appointed from shortlisting
- James did not disclose his disability at the application stage but has referenced his sexual orientation in his supporting information, making him 1.11 times less likely to be appointed from shortlisting than heterosexual applicants.
- Malaika did not disclose her disability or sexual orientation in her application; however, being from a BME ethnic background will make her 1.69 times less likely to be appointed from shortlisting in comparison to the other white applicants.
- Aadhya was recruited internationally as all other international candidates will likely be from a BME ethnic background, and she identifies as heterosexual with no known disabilities; she is at parity (1.00) to be appointed from shortlisting.
- Emma disclosed her disability upon application and asked for reasonable adjustments during her interview. This will make Emma 1.19 less likely to be appointed from the shortlisting than the other non-disabled applicants.

Relative likelihood of being appointed from shortlisting graph description: Line graph comparing likelihood of being appointed from shortlisting against 'Parity' across four individuals: James, Malaika, Aadhya, and Emma. The x-axis lists the individuals' names, and the y-axis ranges from -2.0 to 1.0. The purple line for 'Likelihood' starts at -1.0 for James, drops to -1.5 for Malaika, rises to 1.0 for Aadhya, and falls back to -1.5 for Emma. The orange line for 'Parity' remains constant at 1.0 for all individuals.
Relative likelihood of entering the formal disciplinary process
- James chooses not to disclose his disability to the Trust. As an openly gay man, he is 9% less likely to enter the formal disciplinary process compared to his heterosexual colleagues.
- Malaika discloses her disability upon appointment. This makes her nearly 10 times more likely to face formal disciplinary action than her non-disabled peers.
- Aadhya, from a Black and Minority Ethnic (BME) background, is 11% less likely to enter the formal disciplinary process compared to her white colleagues.
- Emma discloses her disability at the interview stage and receives all the reasonable adjustments needed for her role. As a white bank staff member, she is half as likely to face formal disciplinary action compared to her BME bank colleagues, who are twice as likely to enter the process.

Relative likelihood of entering the formal disciplinary process graph description: Line graph comparing 'Likelihood' of entering the formal disciplinary process and 'Parity' across four individuals: James, Malaika, Aadhya, and Emma. The x-axis lists the individuals' names, and the y-axis ranges from -10 to 2. The purple line for 'Likelihood' starts at 2 for James, drops sharply to -10 for Malaika, rises to 1 for Aadhya, and slightly drops to 0 for Emma. The orange line for 'Parity' remains constant at 1 for all individuals.
Using data from the 2024 NHS Staff Survey, we can better understand how often staff report harassment, bullying, or abuse from colleagues, managers, service users, the public, or others in the workplace.
Ethnicity: over the past 12 months, average percent personally experiencing harassment, bullying or abuse at work
- James, a white, substantive staff member, is cumulatively 40.8% likely to experience such behaviours within a 12-month period.
- Malaika, a Black African, disabled substantive staff member, faces a significantly higher 85.4% cumulative likelihood of encountering such behaviours within a 12-month period.
- Aadhya, an Asian, internationally recruited staff member, is cumulatively 66.55% likely to experience these behaviours within a 12-month period.
- Emma, a white bank staff member, is cumulatively 60.67% likely to face such behaviours within a 12-month period.
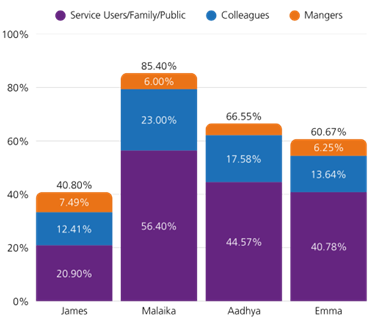
Ethnicity over the past 12 months, average percent personally experiencing harassment, bullying or abuse at work graph description: Bar graph showing the average percent personally experiencing harassment, bullying or abuse at work for four individuals: James, Malaika, Aadhya, and Emma based on ethnicity. The y-axis ranges from 0% to 100%. Each individual has three bars representing interaction types: purple for Service Users/Family/Public, blue for Colleagues, and orange for Managers. James: 20.90% Service Users/Family/Public, 12.41% Colleagues, 7.49% Managers. Malaika: 56.40% Service Users/Family/Public, 23.00% Colleagues, 6.00% Managers. Aadhya: 44.57% Service Users/Family/Public, 17.58% Colleagues, 4.40% Managers. Emma: 40.78% Service Users/Family/Public, 13.64% Colleagues, 6.25% Managers.
Disability: over the past 12 months, average percent of personally experiencing harassment, bullying or abuse at work
- James, a disabled, non-clinical substantive staff member, is cumulatively 58% likely to experience such behaviours within a 12-month period.
- Malaika, a disabled non-clinical substantive staff member, is cumulatively 58% likely to experience such behaviours within a 12-month period.
- Aadhya, a non-disabled clinical substantive staff member, is cumulatively 37% likely to experience these behaviours within a 12-month period.
- Emma, a disabled clinical bank staff member, is cumulatively 48.46% likely to face such behaviours within a 12-month period.
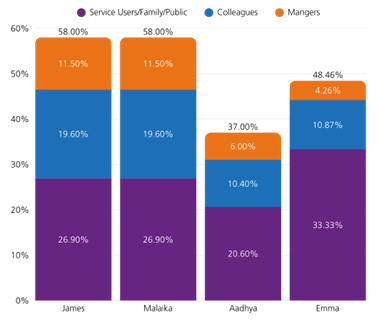
Disability, over the past 12 months, average percent of personally experiencing harassment, bullying or abuse at work graph description: Stacked bar chart showing the percentage distribution of average percent of personally experiencing harassment, bullying or abuse at work interactions for four individuals: James, Malaika, Aadhya, and Emma based on disability. Each bar is divided into three categories: purple for Service Users/Family/Public, blue for Colleagues, and orange for Managers. James and Malaika each have 26.90% Service Users/Family/Public, 19.60% Colleagues, and 11.50% Managers, totalling 58.00%. Aadhya has 20.60% Service Users/Family/Public, 10.40% Colleagues, and 6.00% Managers, totalling 37.00%. Emma has 33.33% Service Users/Family/Public, 10.87% Colleagues, and 4.26% Managers, totalling 48.46%.
Sexual orientation: over the past 12 months, average percent of personally experiencing harassment, bullying or abuse at work
- James, a gay, non-clinical substantive staff member, is cumulatively 43.15% likely to experience such behaviours within a 12-month period.
- Malaika, a bisexual non-clinical substantive staff member, is cumulatively 64.93% likely to experience such behaviours within a 12-month period.
- Aadhya, a heterosexual clinical substantive staff member, is cumulatively 41.66% likely to experience these behaviours within a 12-month period.
- Emma, a heterosexual clinical bank staff member, is cumulatively 76.53%* likely to face such behaviours within a 12-month period.
* Bank data for sexual orientation is very small, skewing results.
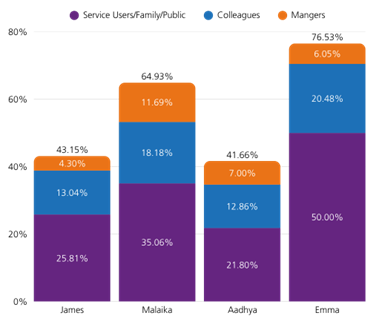
Sexual orientation over the past 12 months, average percent of personally experiencing harassment, bullying or abuse at work graph description: Bar graph showing the percentage of personally experiencing harassment, bullying or abuse at work for four individuals: James, Malaika, Aadhya, and Emma based on sexual orientation. The y-axis ranges from 0% to 80%. Each bar is divided into three segments: purple for Service Users/Family/Public, blue for Colleagues, and orange for Managers. James: 25.81% Service Users/Family/Public, 13.04% Colleagues, 4.30% Managers (total 43.15%). Malaika: 35.06% Service Users/Family/Public, 18.18% Colleagues, 11.69% Managers (total 64.93%). Aadhya: 21.80% Service Users/Family/Public, 12.86% Colleagues, 7.00% Managers (total 41.66%). Emma: 50.00% Service Users/Family/Public, 20.48% Colleagues, 6.05% Managers (total 76.53%).
Intersectional experience of bullying, harassment or abuse
Using data from the previous three examples and the 2024 NHS Staff Survey, we’ve calculated the aggregated average likelihood of staff reporting experiences of harassment, bullying, or abuse over a 12-month period. This includes incidents involving colleagues, managers, service users, the public, and others, viewed through an intersectional identity lens:
- James, a white, gay, disabled, non-clinical substantive staff member, has a 47.32% likelihood of experiencing harassment, bullying, or abuse at work.
- Malaika, a Black African, bisexual, disabled, non-clinical substantive staff member, faces a significantly higher 69.44% likelihood of such experiences.
- Aadhya, an Asian, internationally recruited, clinical substantive staff member, has a 48.40% likelihood of encountering these behaviours.
- Emma, a white, disabled clinical bank staff member, has a 61.89% likelihood of experiencing harassment, bullying, or abuse in the workplace.
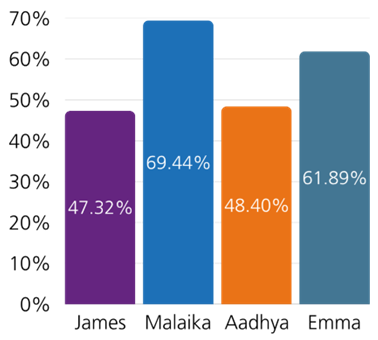
Intersectional experience of bullying, harassment or abuse graph description: Bar graph comparing percentages of intersectional experiences of bullying, harassment or abuse for four individuals: James, Malaika, Aadhya, and Emma. The y-axis ranges from 0% to 70%. James has a purple bar at 47.32%, Malaika has a blue bar at 69.44%, Aadhya has an orange bar at 48.40%, and Emma has a teal bar at 61.89%.