
Declaration rate
- We aim to increase representation of staff from Black and Minority Ethnic (BME) backgrounds within the organisation.
- This data is from the Electronic Staff Record (ESR), excluding bank staff.
- 17.5% of the Trust’s workforce identifies as BME. This equates to 1,382 individuals out of a total workforce of 7,914.
- This marks a 3-percentage point increase from the previous year and meets the Trust’s Model Employer target of 14%.
- Notably, this figure also surpasses the estimated BME population of Lancashire, which stands at 12% based on the 2021 Census.
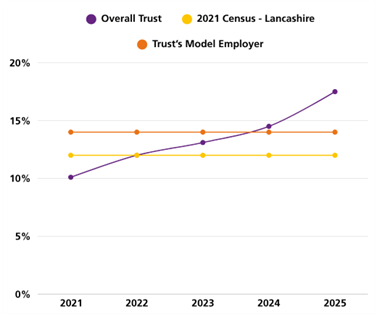
Declaration graph description: Line graph showing three data sets from 2021 to 2025 of declaration of BME backgrounds. The x-axis represents years; the y-axis shows percentages from 0% to 20%. The purple line, labelled "Overall Trust," starts at ~10% in 2021 and rises steadily to ~17% in 2025. The yellow line, labelled "2021 Census – Lancashire," remains flat at ~11% across all years. The orange line, labelled "Trust's Model Employer," stays constant at ~15%.
Disciplinary
- We aim to achieve a metric value close to 1.00, indicating equal likelihood of entering the formal disciplinary process for BME and White staff.
- Based on HR records, BME staff at LSCFT are 0.89 times less likely than their White counterparts to enter a formal disciplinary process.
- This represents a significant improvement from the previous year’s figure of 1.55 and is notably better than both national and North West regional data reported in the 2024 Workforce Race Equality Standard (WRES).
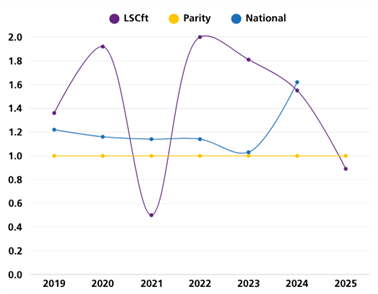
Disciplinary graph description: Line graph showing three data sets from 2019 to 2025 showing likelihood of staff entering the disciplinary process. The x-axis represents years; the y-axis shows values from 0.4 to 2.0. The purple line, labelled "LSCft," fluctuates significantly—peaking near 1.8 in 2020 and 2022, dipping to ~0.4 in late 2021, and declining again toward 2025. The yellow line, labelled "Parity," remains flat at 1.0 throughout. The blue line, labelled "National," shows minor variation—starting around 1.2, dipping slightly below in mid-2023, and rising again by late 2024.
Continuous professional development (CPD)
- We aim to increase the participation of BME staff in non-mandatory Continuous Professional Development (CPD).
- HR data since 2019 shows that LSCFT has consistently maintained a favourable position, with a relative likelihood ratio ranging from 0.78 to 0.90.
- This indicates that BME staff are at least as likely - or more likely - to access non-mandatory training and development opportunities compared to White staff.
- Due to this sustained performance, LSCFT has been nationally recognised as one of the top 10 NHS organisations demonstrating continuous improvement in this area.
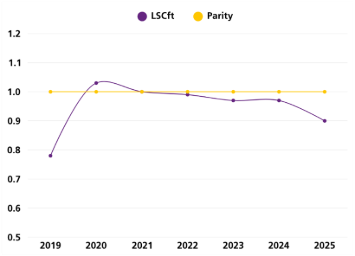
Continuous professional development graph description: Line graph comparing LSCft and Parity from 2019 to 2025 of the participation of BME staff in non-mandatory CPD. The x-axis shows years; the y-axis ranges from 0.5 to 1.2. The purple line, representing LSCft, starts at ~0.8 in 2019, peaks at ~1.05 in 2020, then gradually declines to ~0.85 by 2025. The yellow line, representing Parity, remains constant at 1.0 throughout the entire period.
Recruitment
- We are working to improve the appointment rate of Black and Minority Ethnic (BME) candidates following shortlisting, aiming to achieve a metric value close to 1.00 to reflect parity in appointment outcomes between BME and White applicants.
- This indicator, derived from the TRAC recruitment system, measures the relative likelihood of appointment after shortlisting for both groups.
- In 2025, BME applicants were 1.69 times less likely to be appointed than their White counterparts. While this still reflects a disparity, it represents an improvement from the 2024 figure of 1.86, suggesting progress towards greater equity in recruitment outcomes.
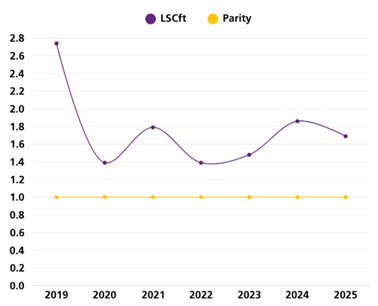
Recruitment graph description: Line graph comparing two datasets, LSCft (purple) and Parity (yellow), from 2019 to 2025 showing the appointment of BME candidates following shortlisting. The x-axis shows years; the y-axis ranges from 0.0 to 2.8. The LSCft line starts at ~2.7 in 2019, drops to ~1.3 in 2020, rises to ~1.7 in 2021, dips to ~1.4 in early 2022, then gradually increases to ~1.8 by mid-2023, peaking just below 2.0 in the later years. The Parity line remains flat at 1.0 across all years.
Harassment, bullying or abuse: colleagues
- We aim to reduce incidents of bullying, harassment, or abuse experienced by BME staff from colleagues.
- According to the National Staff Survey (NSS) 2024, 22.6% of BME staff reported such experiences, up from 18.4% the previous year. This increase is concerning and indicates a widening gap between the experiences of BME and White staff.
- When broken down by ethnicity, the data shows a deterioration across all groups except for African staff, whose reported experiences remained stable.
- Notably, the percentage of staff identifying as "Any other ethnicity" who reported such incidents rose significantly from 20.0% to 30.8%.
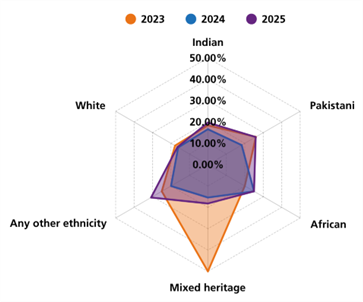
Harassment, bullying or abuse colleagues graph description: Radar chart comparing percentage distribution of bullying, harassment or abuse experienced by six ethnicities—Indian, Pakistani, African, Mixed heritage, Any other ethnicity, and White—across three years: 2023 (orange), 2024 (blue), and 2025 (purple). Each axis ranges from 0% to 50% in 10% increments. The chart shows how the distribution of each ethnicity varies year by year, with each year represented by a distinct coloured polygon.
Career development
- We strive to ensure that all staff believe they have equal opportunities for career progression and promotion.
- According to the NSS 2024, 54.7% of BME staff believe the Trust provides equal opportunities.
- Although the gap between BME and White staff has narrowed, this figure represents a decline from the previous year, which may indicate a need for a renewed focus on equity in career development.
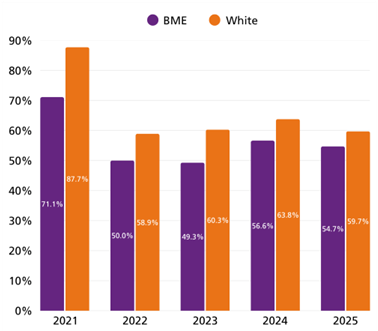
Career progression graph description: Bar graph comparing the percentage of BME and White individuals from 2021 to 2025 who believe they have equal opportunity for career progression. The x-axis shows years; the y-axis represents percentages. Purple bars represent BME, and orange bars represent White. In 2021, BME is 71.1% and White is 87.7%. In 2022, BME is 50.0% and White is 58.9%. In 2023, BME is 49.3% and White is 60.3%. In 2024, BME is 56.6% and White is 63.8%. In 2025, BME is 54.7% and White is 59.7%.
Discrimination at work: colleagues and/or manager
- We are working to reduce workplace discrimination experienced by BME staff.
- The NSS 2024 reports that 17.4% of BME staff experienced discrimination from colleagues or managers, an increase of almost 4% from the previous year.
- This marks a continued deterioration since 2023 and has widened the disparity between BME and White staff, potentially indicating a decline in workplace equity.
- When disaggregated by ethnicity, the indicator worsened for all groups except African staff, whose reported experiences of discrimination decreased from 25.0% to 20.6%.
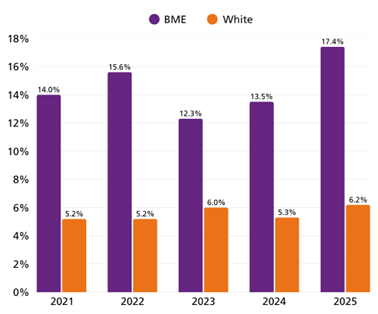
Discrimination at work: colleagues and/or manager graph description: Bar graph comparing the percentage of Black and Minority Ethnic (BME) and White individuals from 2021 to 2025 who experienced discrimination at work from colleagues or manager. The x-axis shows years; the y-axis ranges from 0% to 18%. Each year includes two bars: purple for BME and orange for White. Percentages for BME individuals are: 14.0% (2021), 15.6% (2022), 12.3% (2023), 13.5% (2024), and 17.4% (2025). Percentages for White individuals are: 5.2% (2021), 5.2% (2022), 6.0% (2023), 5.3% (2024), and 6.2% (2025).